Young Elected Leaders Project – State Legislature Dashboard
The Young Elected Leaders Project tracks the age composition of state legislatures across the country. Following the 2024 elections, 506 Young Elected Leaders (aged 35 or younger) took office, representing 8% of all state legislators nationwide.
- Full State Legislatures: 506 / 6,322 (8%)
- Lower Chambers: 418 / 4,603 (9%)
- Upper Chambers: 88 / 1,719 (5%)
As data are gathered for each state, it will be listed below. Find your state legislature’s current age snapshot here:
Scroll Below to view age national across America’s State Legislatures
Age in Lower Chambers
On November 4th, 2024, in addition to voting in Presidential and Congressional elections, voters weighed in on control of state legislatures in 44 states. Following those elections, 4,603 representatives took office in 2025 across the lower chambers within these state legislatures. The age of these representatives remains an increasingly fascinating and dynamic aspect. Of those elected, 418(9.08%) were Young Elected Leaders, aged 35 or under as of Election Day in 2024. Below is the distribution of these representatives within the 44 states that held elections in 2024.
Facts within the Lower Chambers
Below is information covering age dynamics in the recently elected to lower chambers across America’s state legislatures
- The average age within the lower chambers is 54.18 years
- The youngest Representative, Lukas Schubert of Montana, who was born in 2005
- the oldest Representative, Joseph A. Guthrie of New Hampshire, who was born in 1929
- 418 Representatives are Young Elected Leaders age 35 or younger as of Election Day 2024
Generational Breakdown
Within lower state legislative chambers, most representatives come from the Millennial, Generation X or The Baby Boomer generation. Importantly, only a few members of these current bodies belong to Generation Z. Scroll below to see the generations in the states visualized.
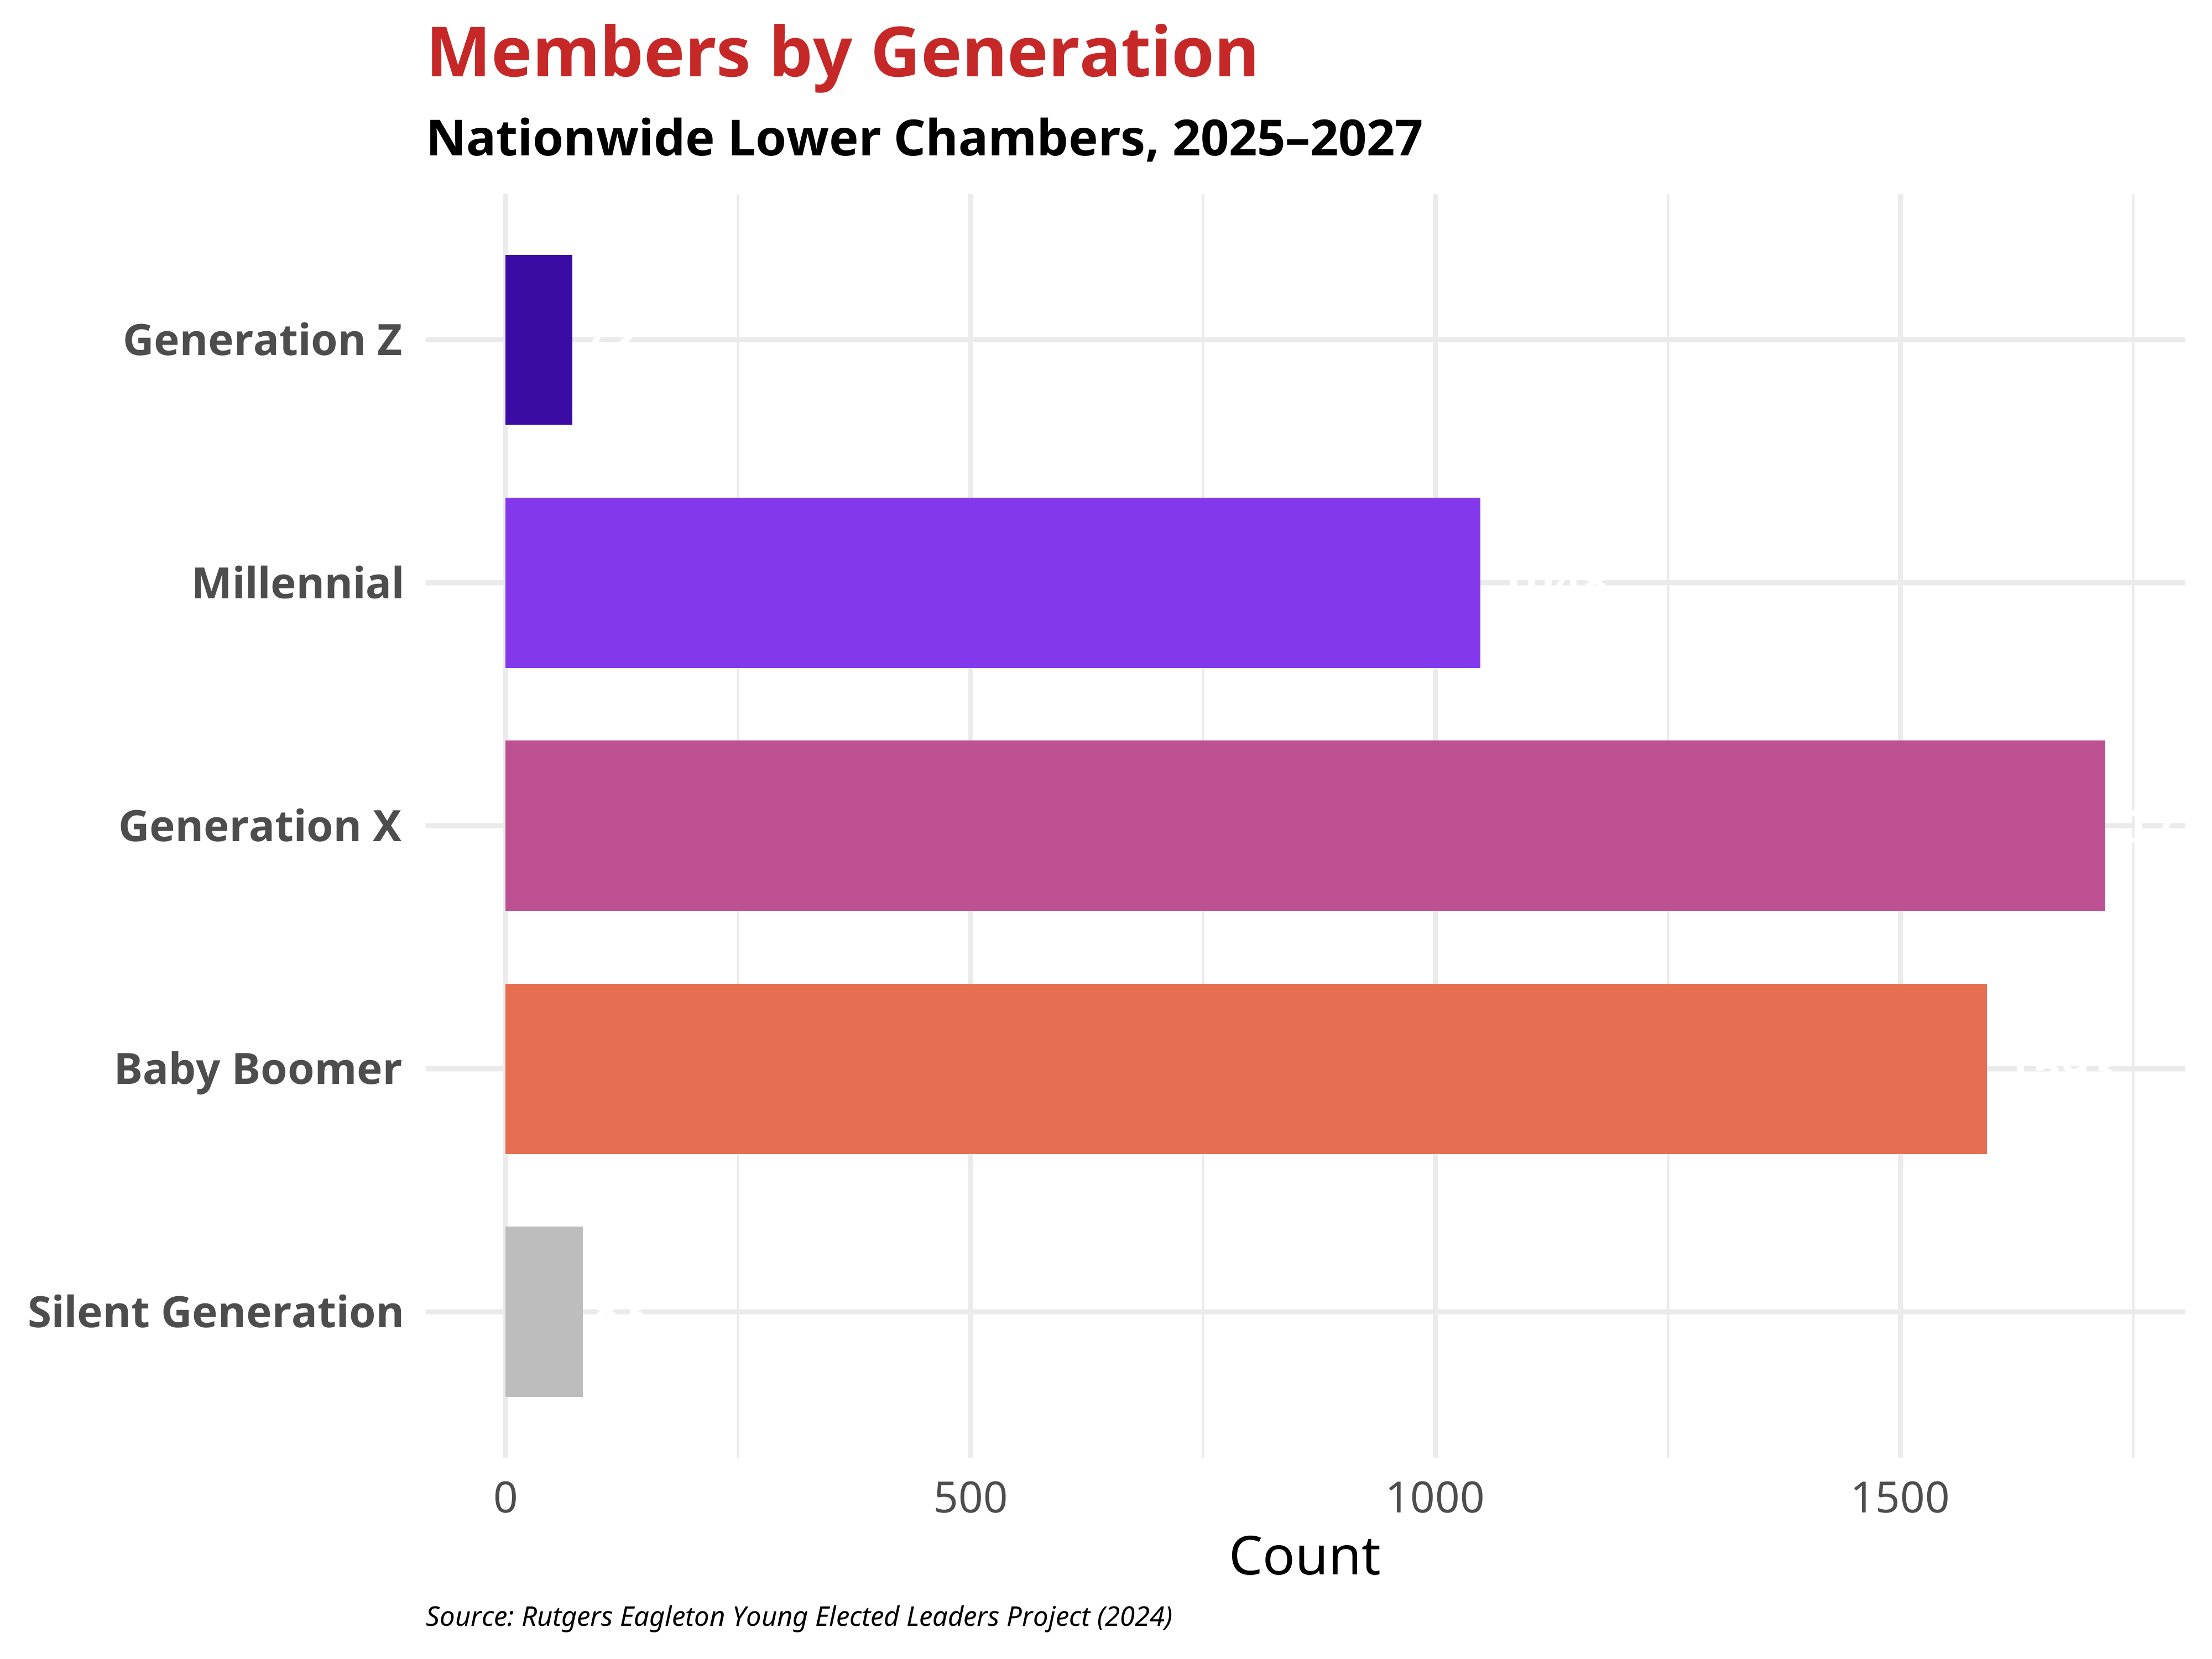
* Ages of 87 members are currently missing. Data comes from the 44 States that held legislative elections in 2024.
Age by Party – Lower Chambers
Partisan dynamics in the lower chambers across America reflect not only ideological differences but also generational contrasts. As shown in the data for the 2025–2027 nationwide lower chambers, there is a clear distinction in the average age of legislators by party. While the average age for Democrats sits at 52.43, Republicans have a higher mean age of 55.5. These figures highlight broader trends in political recruitment and the varying speeds of generational turnover within each party’s candidate pool.
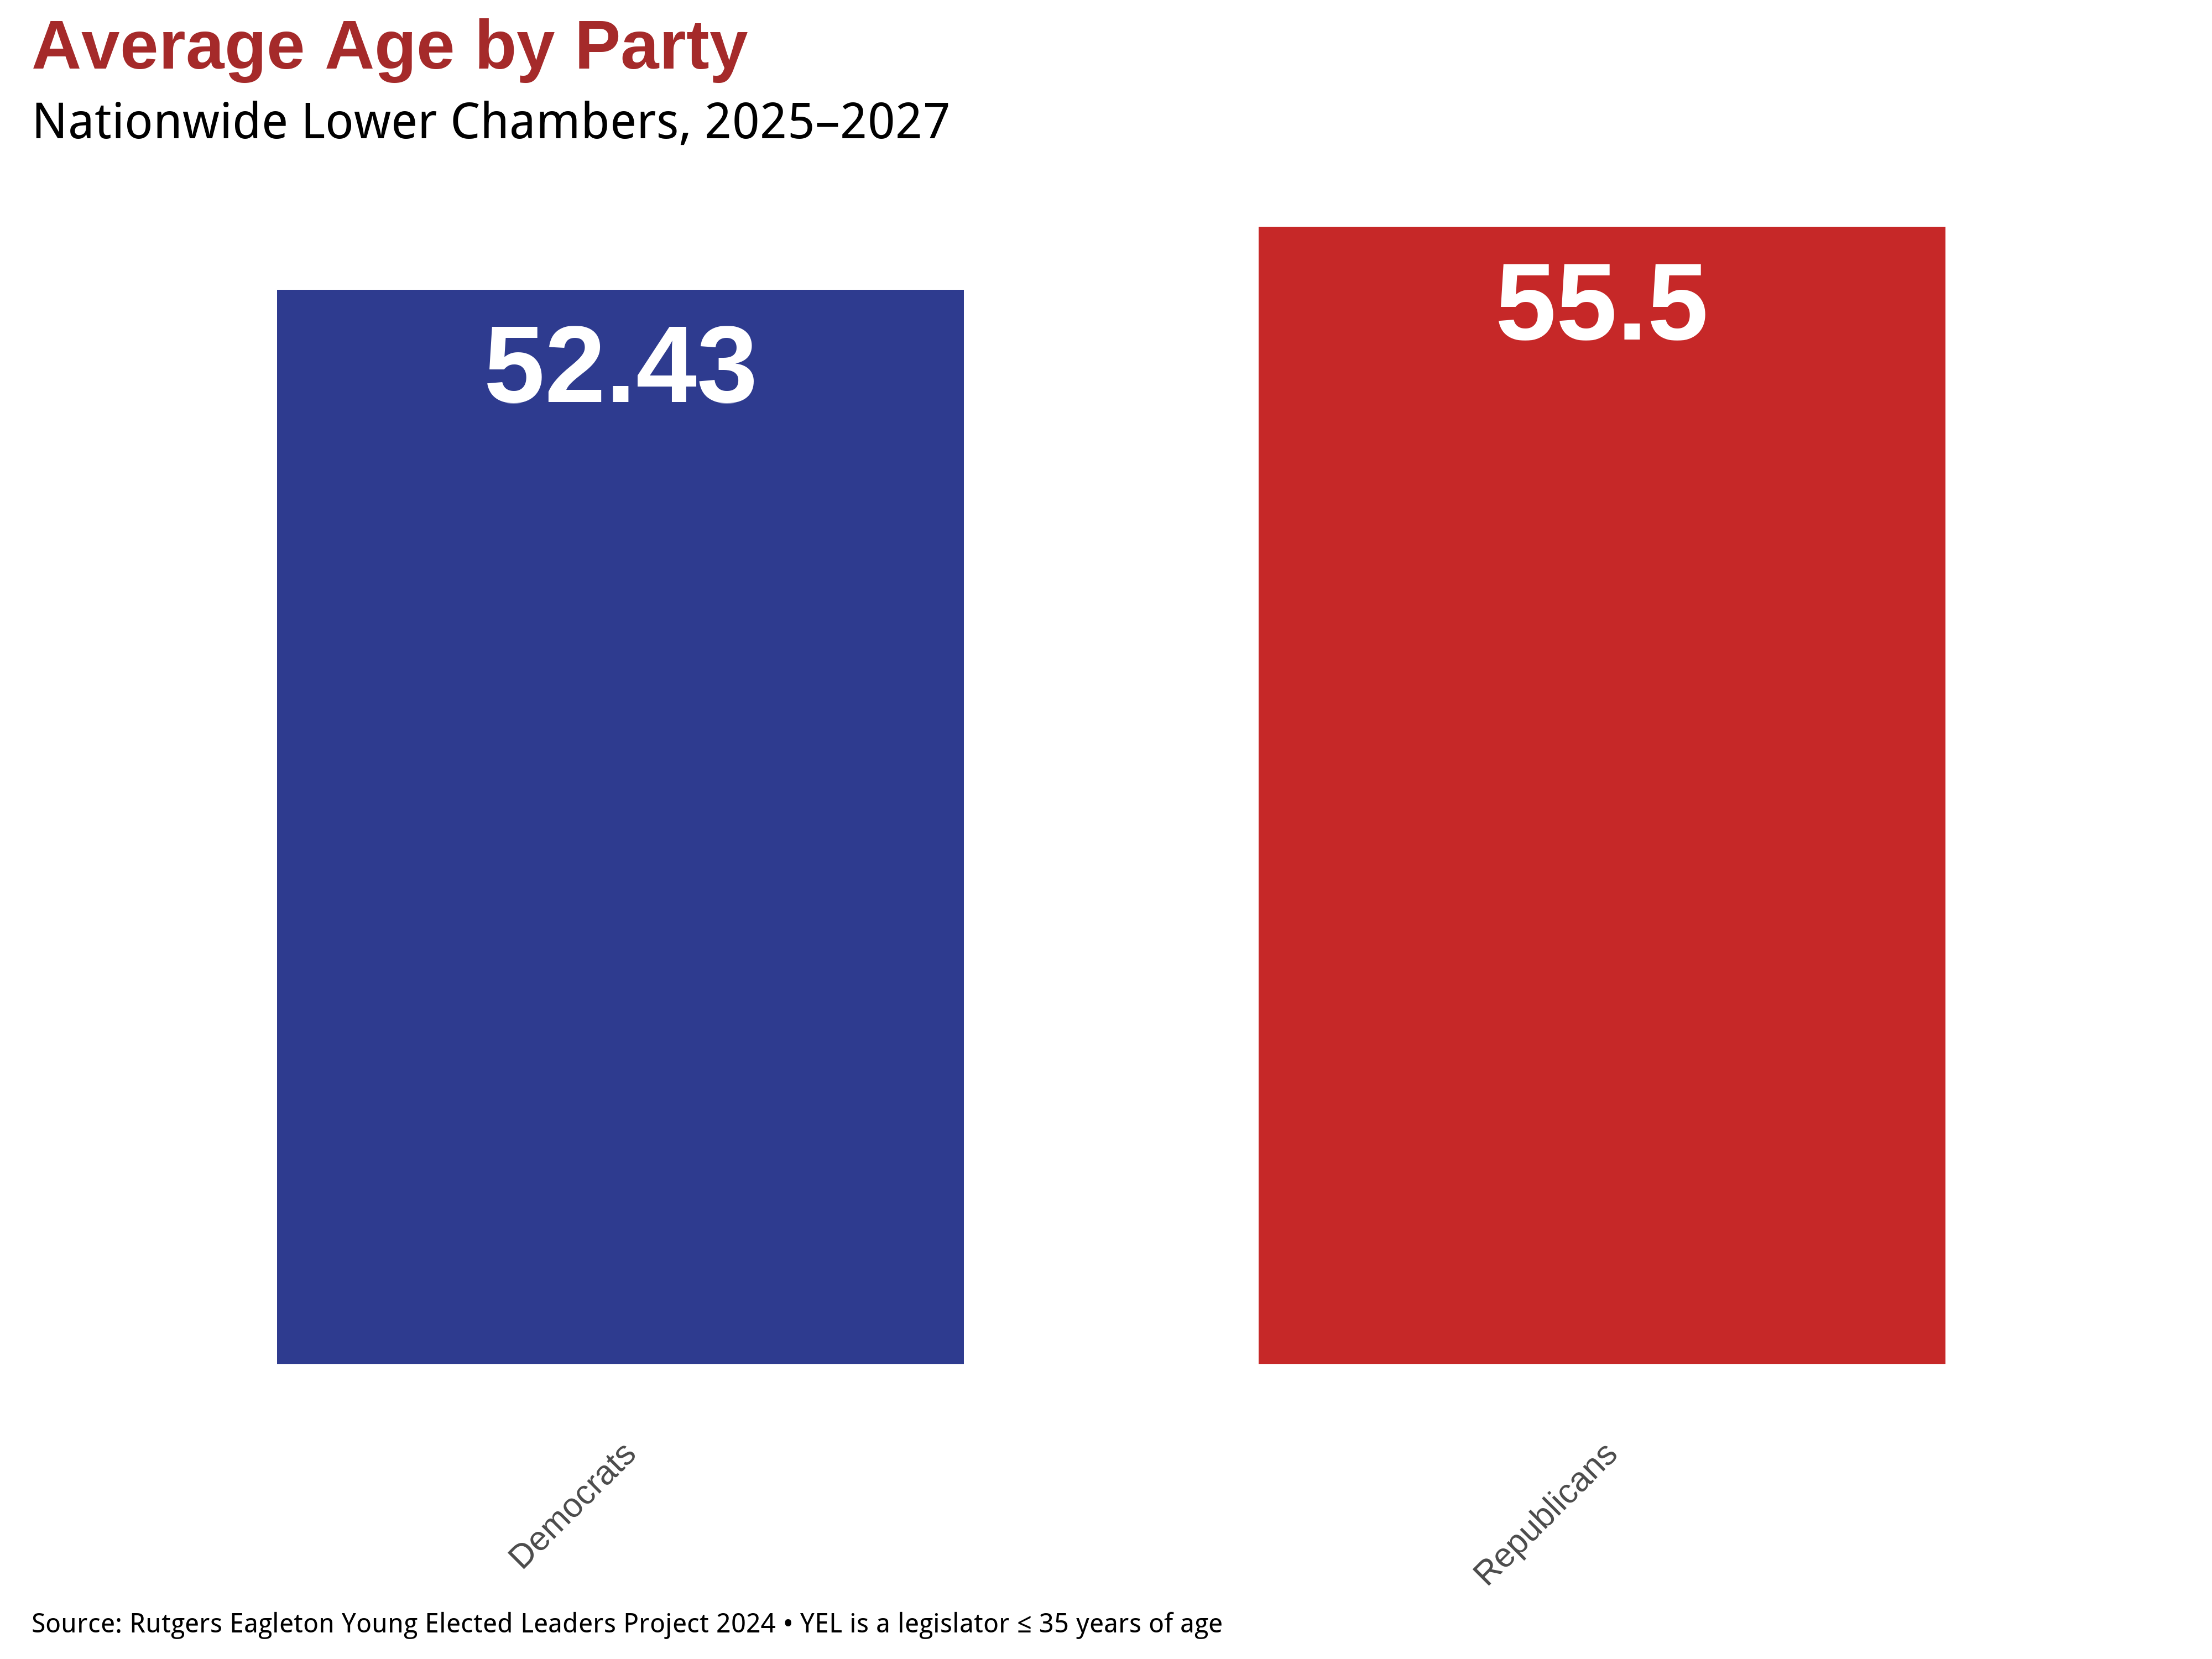
* Ages of 87 members are currently missing. Data comes from the 44 States that held legislative elections in 2024.
Age in Upper Chambers
On November 4th, 2024, in addition to voting in Presidential and Congressional elections, voters weighed in on control of state legislatures in 44 states. Following those elections, 1,719 representatives took office in 2025 across the upper chambers within these state legislatures. The age of these representatives remains an increasingly fascinating and dynamic aspect. Of those elected, 88(5.12%) were Young Elected Leaders, aged 35 or under as of Election Day in 2024. Below is the distribution of these representatives within the 44 states that held elections in 2024.
Facts within the Upper Chambers
Below is information covering age dynamics in the recently elected upper legislative chambers, covering the 1,719 members elected across 44 states:
- The average age of the members of the upper chambers is 56.85 years
- The youngest Senator is Claire Cory of North Dakota, who was born in 1998
- The oldest Senator is Toby Ann Stavisky of New York, who was born in 1925
- Currently, 88 members of upper state legislative chambers are Young Elected Leaders, aged 35 or younger as of Election Day 2024
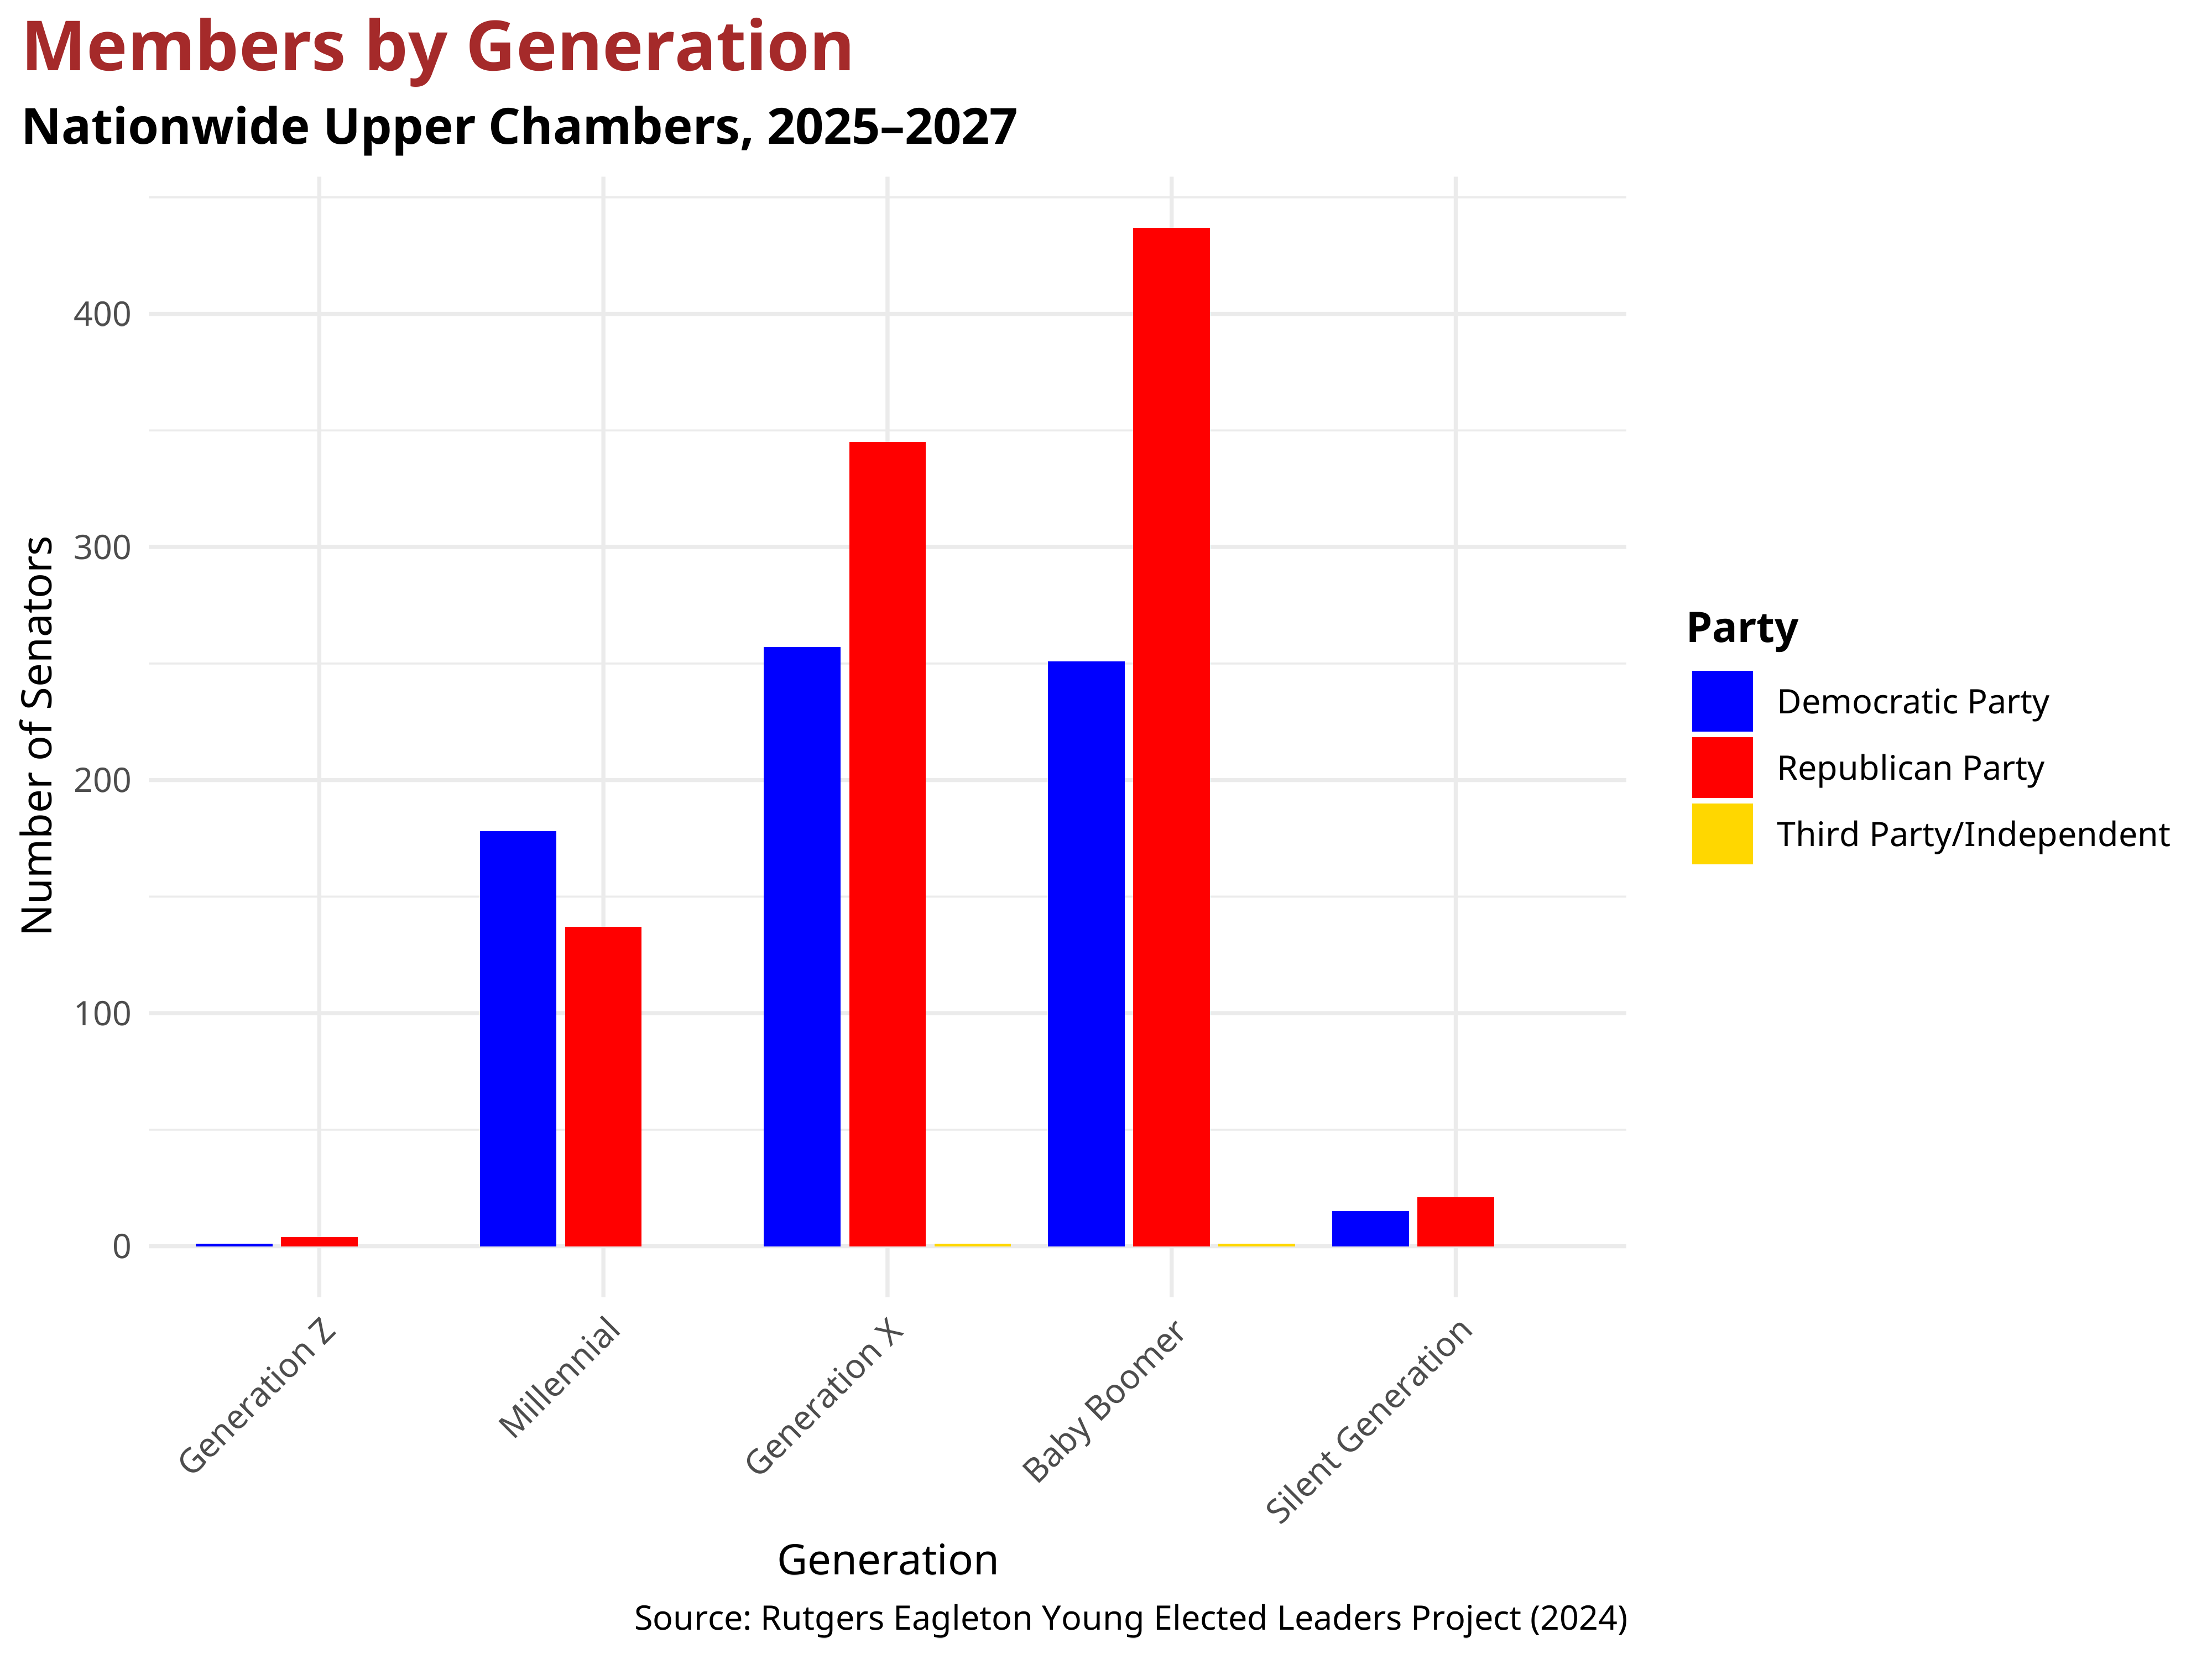
The generational landscape of America’s state senates reveals a significant concentration of power within older cohorts. In the 2025–2027 Nationwide Upper Chambers, the Baby Boomer generation maintains the largest presence, closely followed by Generation X. While Millennials hold a notable share of seats, Generation Z remains the least represented, occupying only a tiny fraction of the total membership. This distribution underscores a slower rate of generational turnover in upper houses compared to lower chambers, reflecting the longer career trajectories and higher age averages typically found in state senates.

* Ages of 22 members are currently missing. Data comes from the 44 States that held legislative elections in 2024.
Age by Party – Upper Chambers
In these upper chambers, the average age of Democratic Representatives at the time of the election was 55.2, while the average age of Republican Representatives was slightly higher at 58.03. In total, 88 members of the newly elected upper legislative chambers were Young Elected Leaders (age 35 or under) as of Election Day 2024, with 47 Democrats and 39 Republicans represented in this cohort.
The generational breakdown further illustrates these partisan trends; while Republicans hold a significant majority within the Baby Boomer and Generation X blocks, Democrats maintain a stronger relative foothold among Millennial members. Despite these shifts, Generation Z remains the least represented across both parties, highlighting that while younger voices are entering the chamber, the vast majority of legislative power in state senates remains held by older generations.
* The ages of 22 members are currently missing. Data comes from the 44 States that held legislative elections in 2024.