Age in the 2025 Massachusetts General Court

The State of Massachusetts held its elections for a new Massachusetts House of Representatives and Massachusetts State Senate on November 4th 2024. In January 2025 the currently active 194th legislative session of the Massachusetts State Legislature. Among the members elected 21 were aged 35 or younger on election day in 2024. Below is a map of these representatives within both chambers of the Massachusetts State Legislature.
Massachusetts Demographic Background in the 2024 Election
Preliminary estimates from CIRCLE at Tufts University indicate that 42% of young people aged 18–29 voted in the 2024 election, with turnout surpassing 50% in key battleground states. Nearly 50 million young citizens were eligible to vote nationwide, including over 8 million who turned 18 since the 2022 midterms.
According to the Pew Research Center, Millennials surpassed Baby Boomers in 2020 to become the largest generation in the U.S., making up 31% of the population, followed closely by Boomers at 30.9%. Generation X accounts for 28%, while the Silent Generation makes up just 9.9%.
The Massachusetts House of Representatives 193rd Legislative Session
Below is information covering age dynamics in the recently elected to the Massachusetts House of Representatives
- the average age of Massachusetts House of Representatives members is 51.25 years
- the youngest Representative Tara Thorn Hong was born in 2000
- the oldest Representative Paul J. Donato was born in 1941
- 18 Representatives are Young Elected Leaders age 35 or younger as of Election Day 2024
Generational Breakdown
Within the Massachusetts House of Representatives, most representatives come from the Millennial, Generation X or The Baby Boomer generation. Importantly, only a few members of the current Massachusetts House of Representatives belong to Generation Z. Scroll below to see the generations in the Massachusetts House of Representatives visualized.
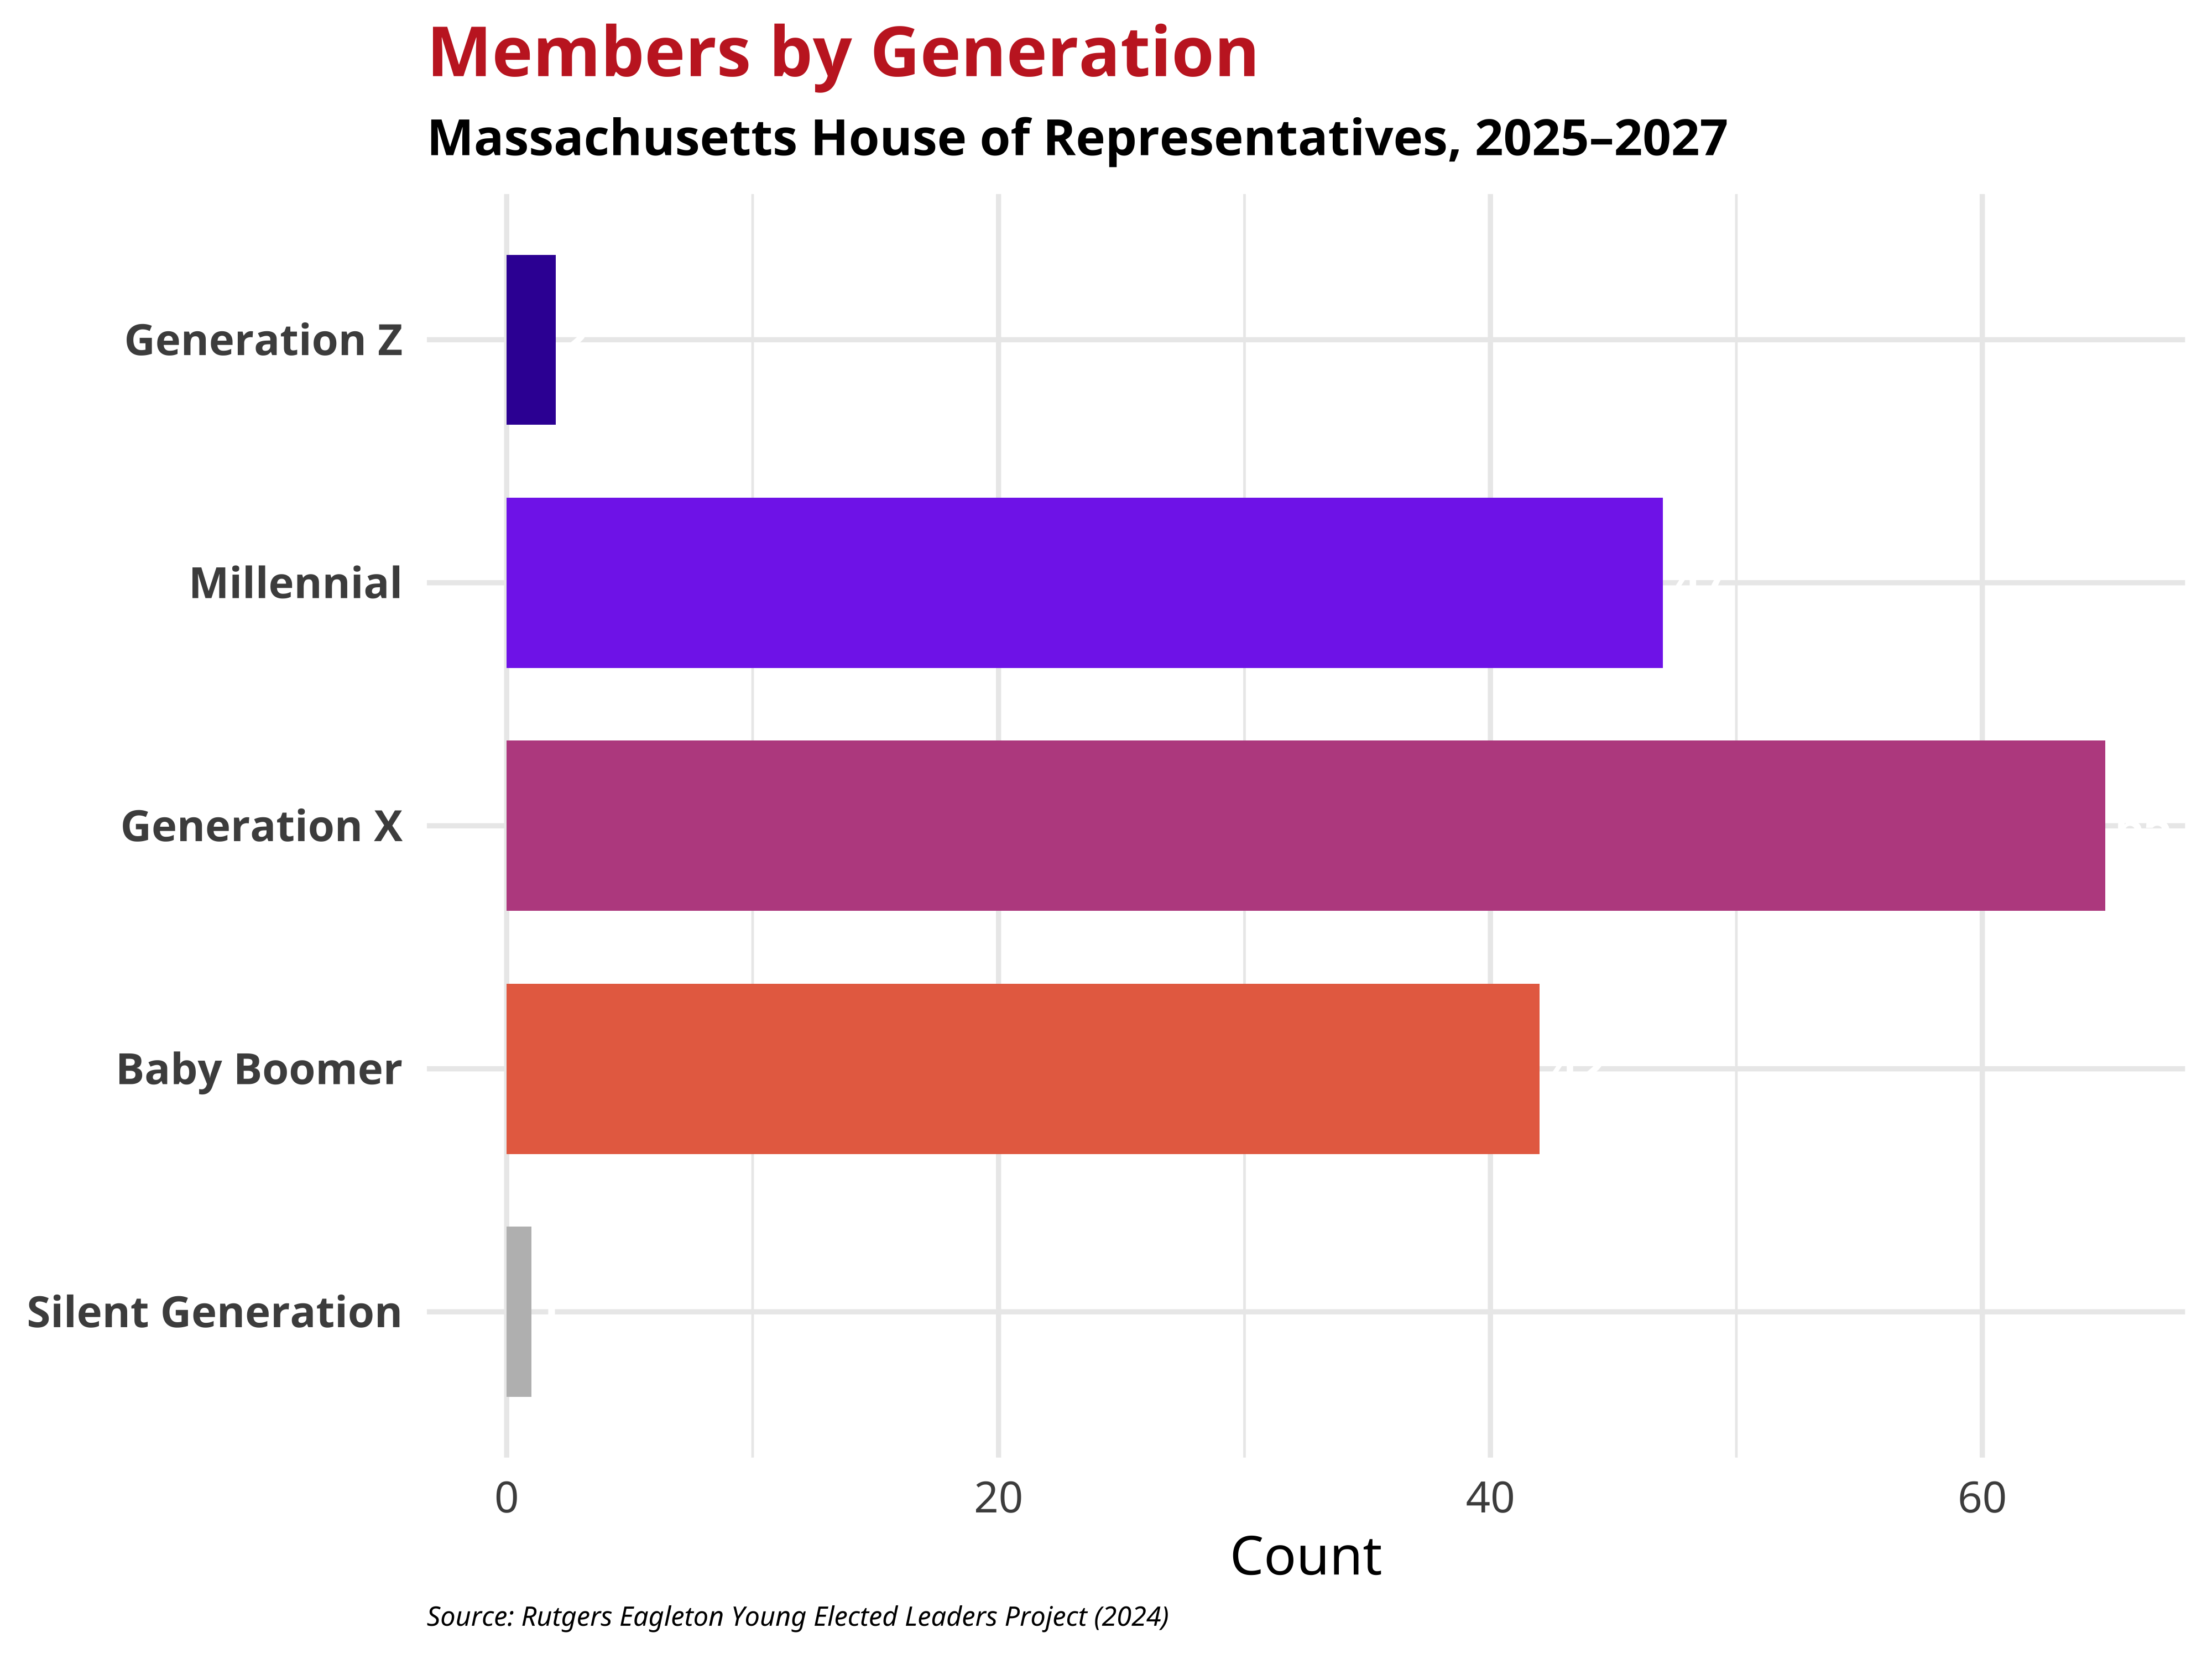
* Two House members ages are currently missing, and one House seats remains vacant.
Partisanship in the Massachusetts House of Representatives
The chart below further breaks down the current partisan makeup of the 2025 Massachusetts House of Representatives. Each dot represents a single member, colored by both party affiliation and whether the legislator qualifies as a Young Elected Leader (YEL)—defined as age 35 or younger at the time of the election. This format provides a visual snapshot of generational and partisan distribution within the chamber, highlighting how younger legislators are positioned across party lines.
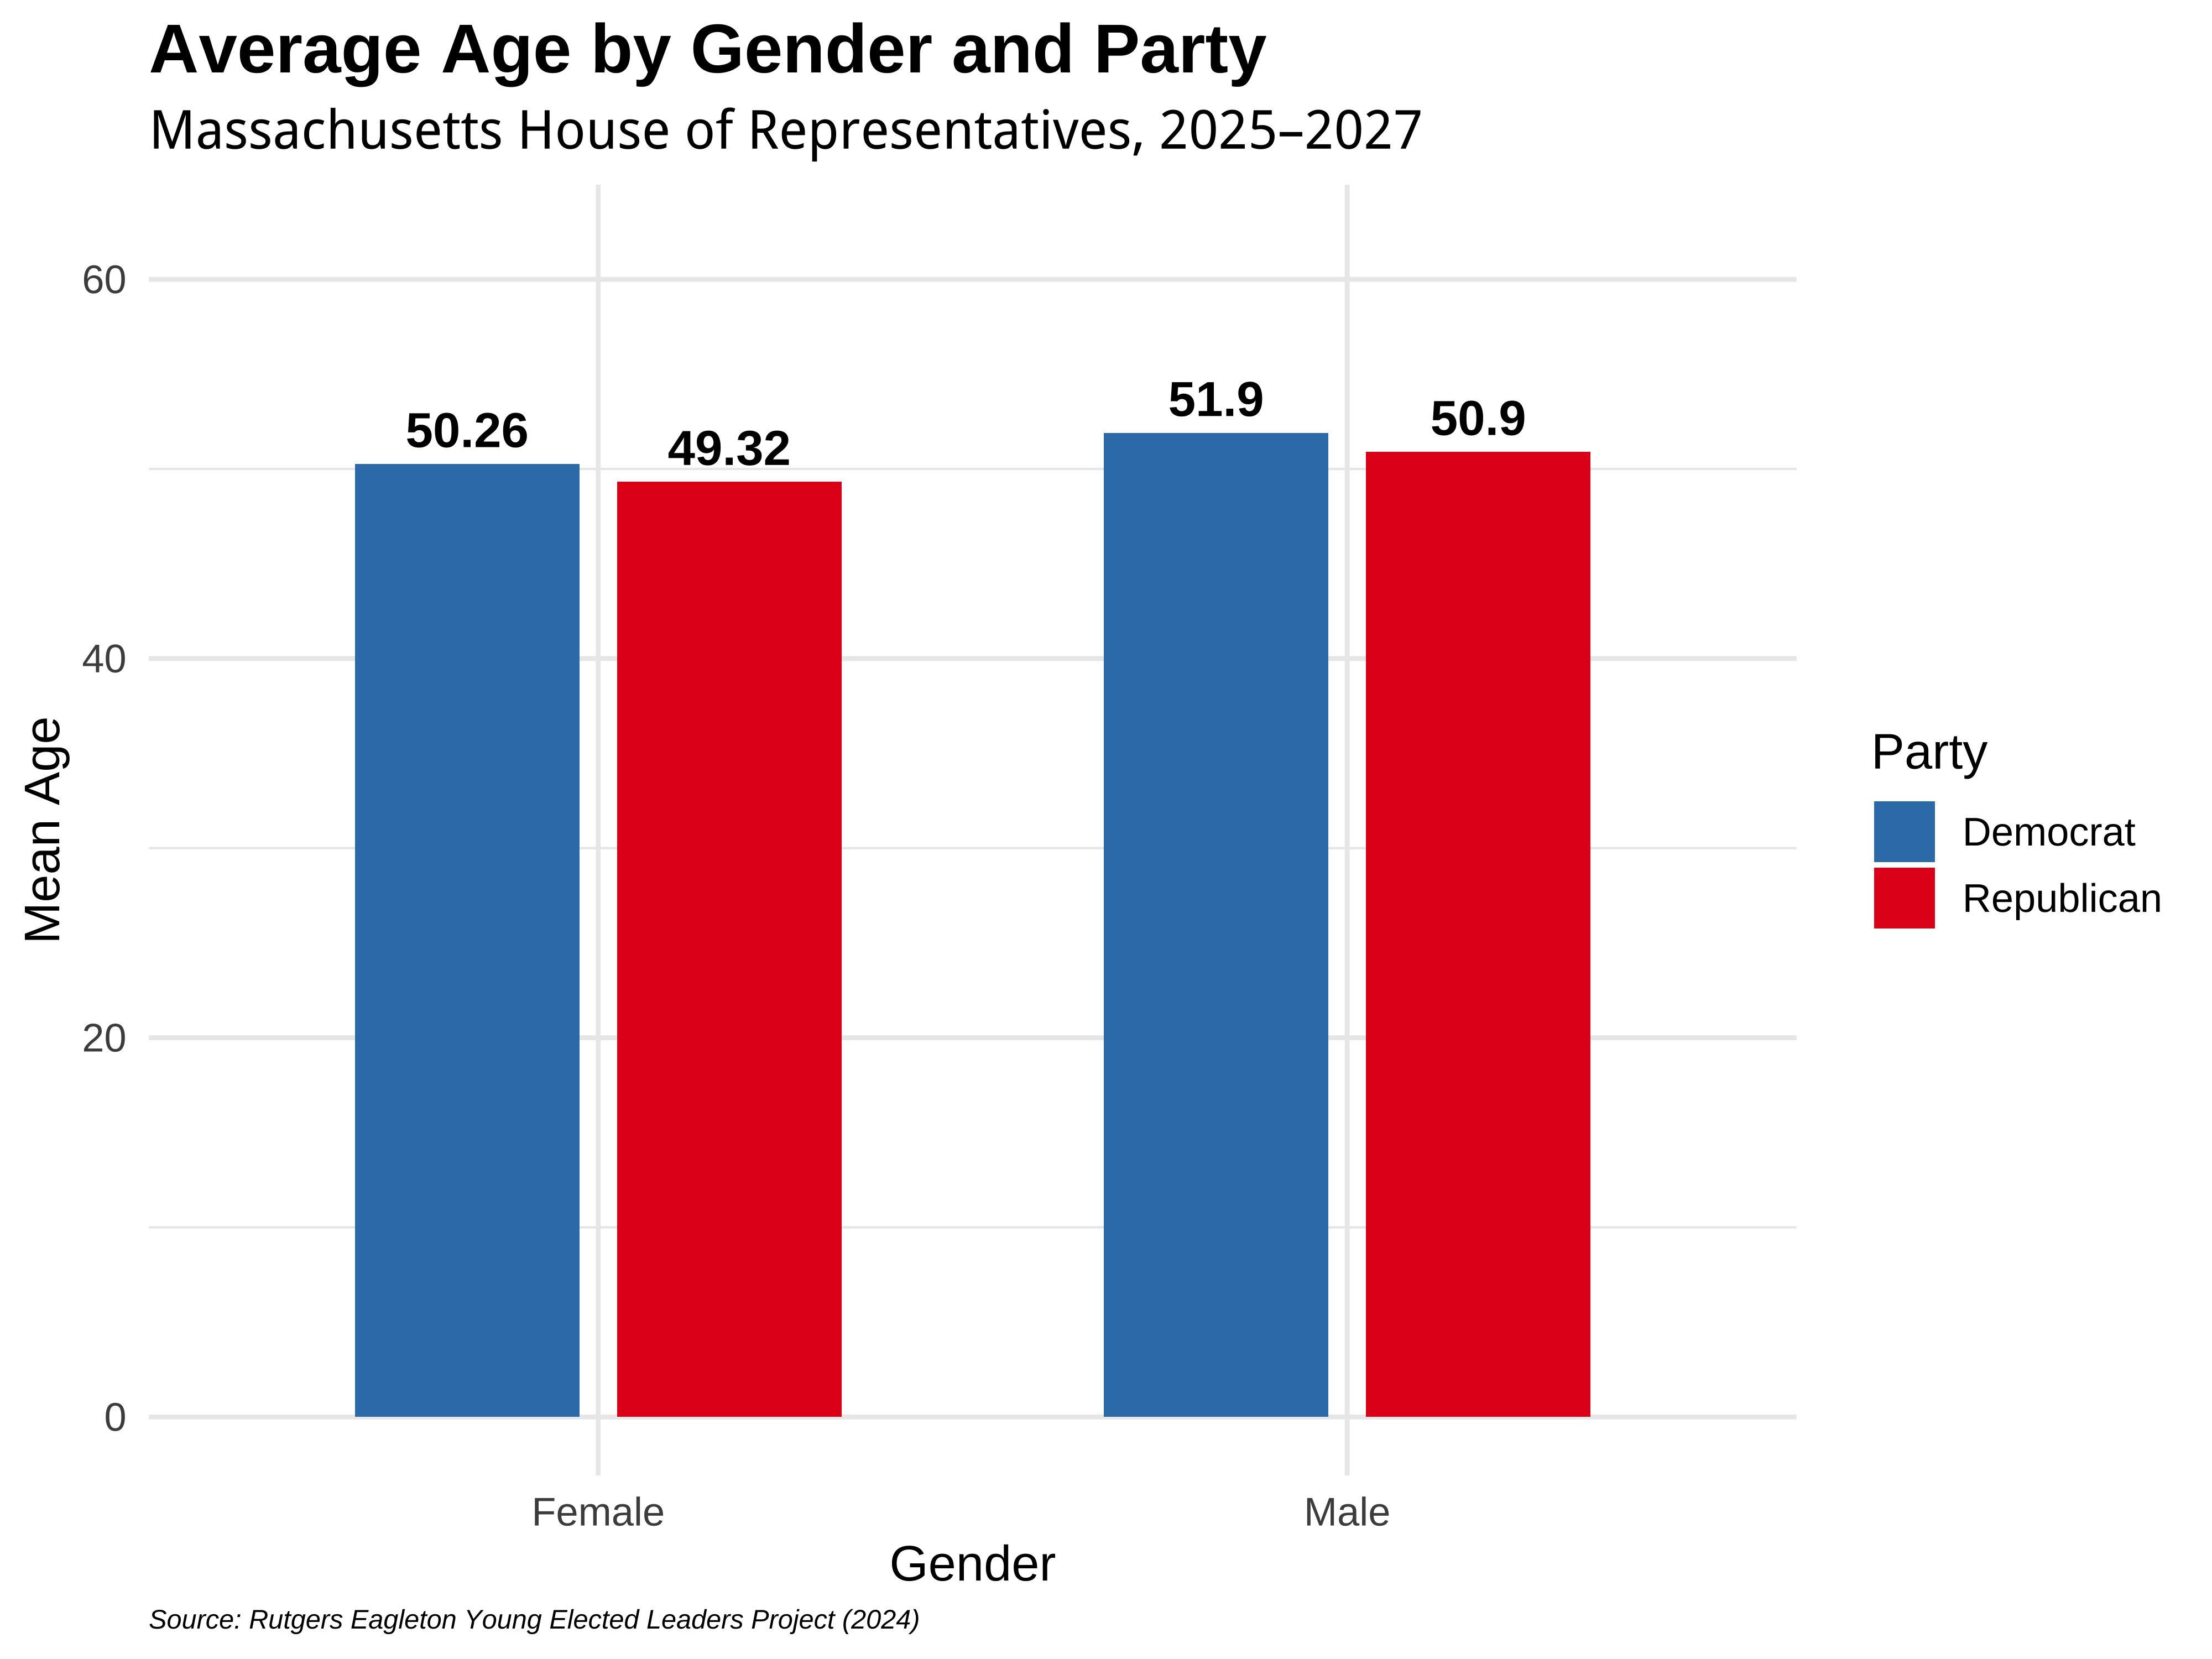
Partisan dynamics in the Massachusetts House of Representatives reflect not only ideological differences but also generational contrasts. The visual below highlights one key distinction: the average age of legislators by party. Overall in the Massachusetts House of Representatives both parties have identical average ages, both over 50 years old respectively. Differences in average ages may reflect broader trends in political recruitment, generational turnover, and candidate emergence in recent election cycles.
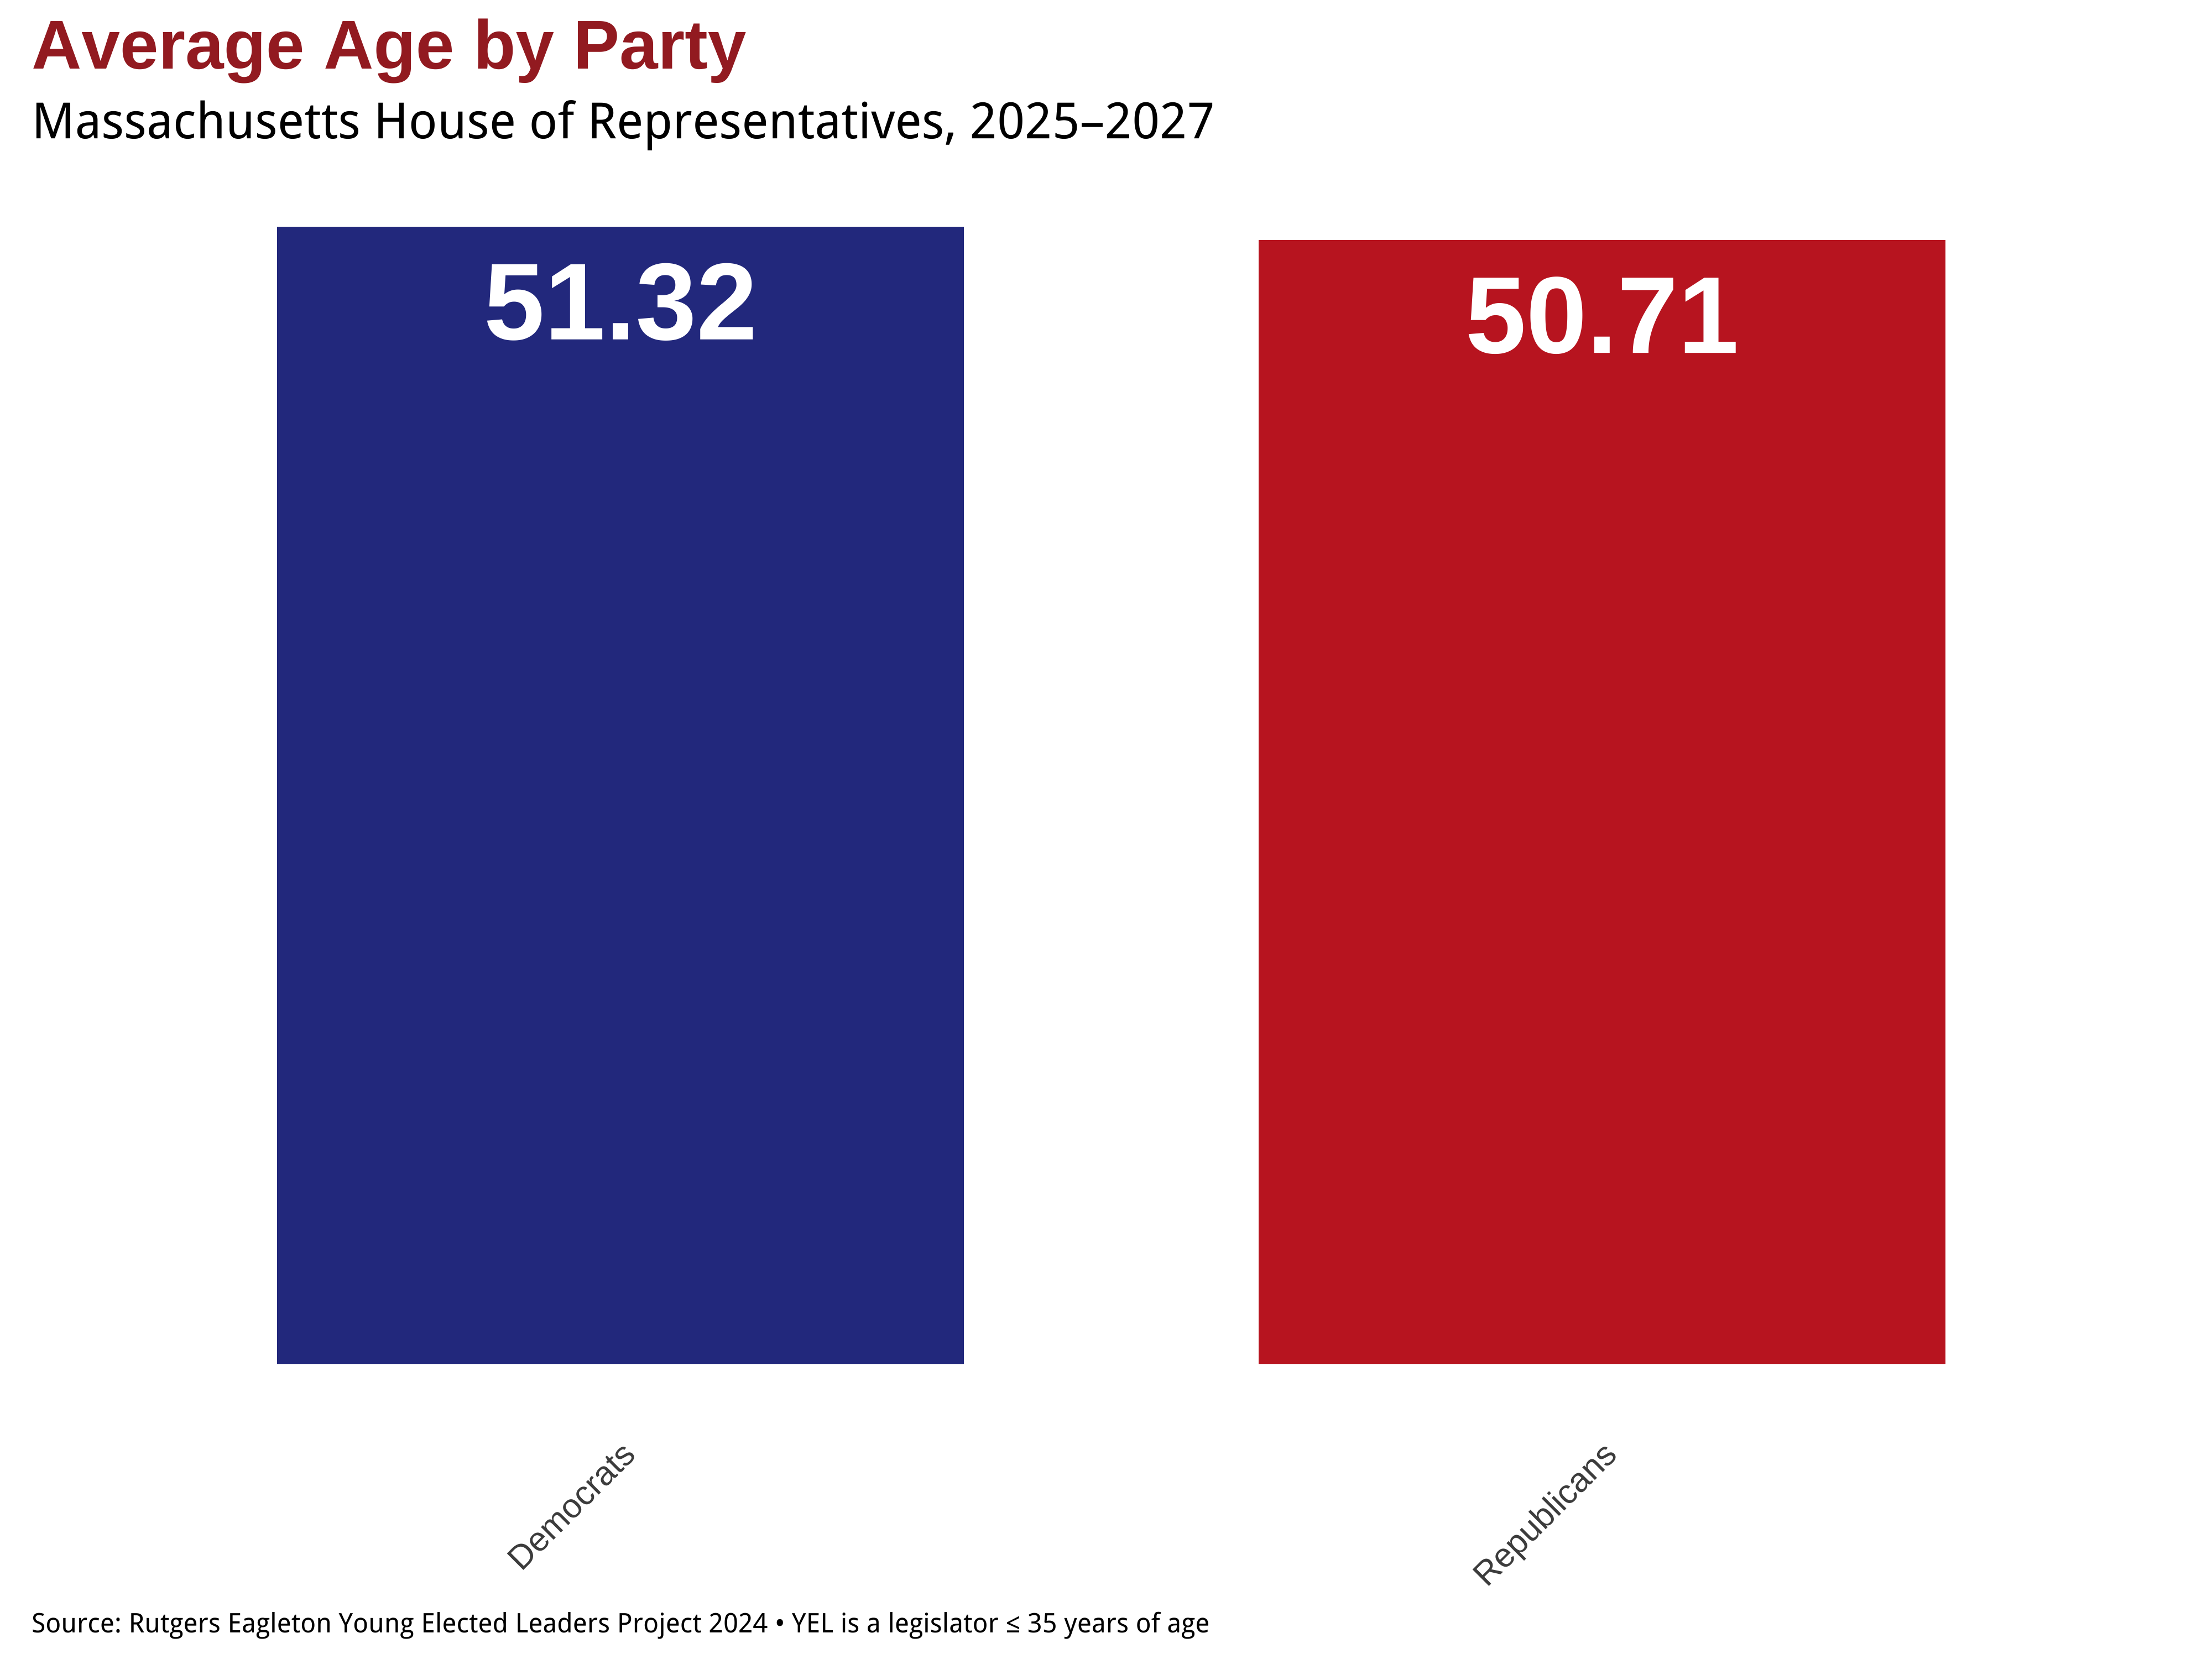
* Two House members ages are currently missing, and one House seats remains vacant.
Young Elected Representatives – Massachusetts House of Representatives
Following the 2024 State Legislative Elections in Massachusetts, eighteen members aged 35 or under were elected to the Massachusetts House of Representatives. Below are all eighteen of these members, listed in the provided order, along with information about their local districts and party affiliation.
| Name | District | Birth year (Age on Election Day) | Year first elected to Massachusetts House | |
|---|---|---|---|---|
 |
Tara Thorn Hong (D) | 76th District –
Lowell, MA |
2000 (Age 24) | 2024 |
 |
Ryan M. Hamilton (D) | 38th District –
Methuen, MA |
1998 (Age 26) | 2022 |
 |
Adam J. Scanlon (D) | 23rd District –
North Attleboro, MA |
1996 (Age 28) | 2020 |
 |
Kenneth Peter Sweezy (R) | 116th District –
Hanson, MA |
1996 (Age 28) | 2024 |
 |
Michael Chiasson (R) | 10th District –
Dedham, MA |
1995 (Age 29) | 2024 |
 |
Patrick Joseph Kearney (D) | 114th District –
South Shore, MA |
1995 (Age 29) | 2018 |
 |
Sean Reid (D) | 34th District –
Lynn, MA |
1995 (Age 29) | 2024 |
 |
Thomas W. Moakley (D) | 6th District –
Falmouth, MA |
1994 (Age 30) | 2024 |
 |
Andres X. Vargas (D) | 26th District –
Haverhill, MA |
1993 (Age 31) | 2017 |
 |
Bridget M. Plouffe (D) | 119th District –
Brockton, MA |
1991 (Age 33) | 2024 |
 |
Manny Cruz (D) | 30th District –
Salem, MA |
1991 (Age 33) | 2022 |
 |
Jessica Ann Giannino (D) | 138th District –
Revere, MA |
1991 (Age 33) | 2020 |
 |
Judith A. Garcia (D) | 133rd District –
Chelsea, MA |
1991 (Age 33) | 2022 |
 |
David Allen Robertson (D) | 77th District –
Tewksbury, MA |
1990 (Age 34) | 2018 |
 |
Jonathan David Zlotnik (D) | 122nd District –
Gardner, MA |
1990 (Age 34) | 2012 |
 |
Samantha Montano (D) | 137th District –
Jamaica Plain, MA |
1990 (Age 34) | 2018 |
 |
David LeBeouf (D) | 158th District –
Worcester, MA |
1989 (Age 35) | 2018 |
 |
Shirley B. Arriaga (D) | 51st District –
Chicopee, MA |
1989 (Age 35) | 2022 |
Photos courtesy of the Massachusetts House of Representatives member roster.
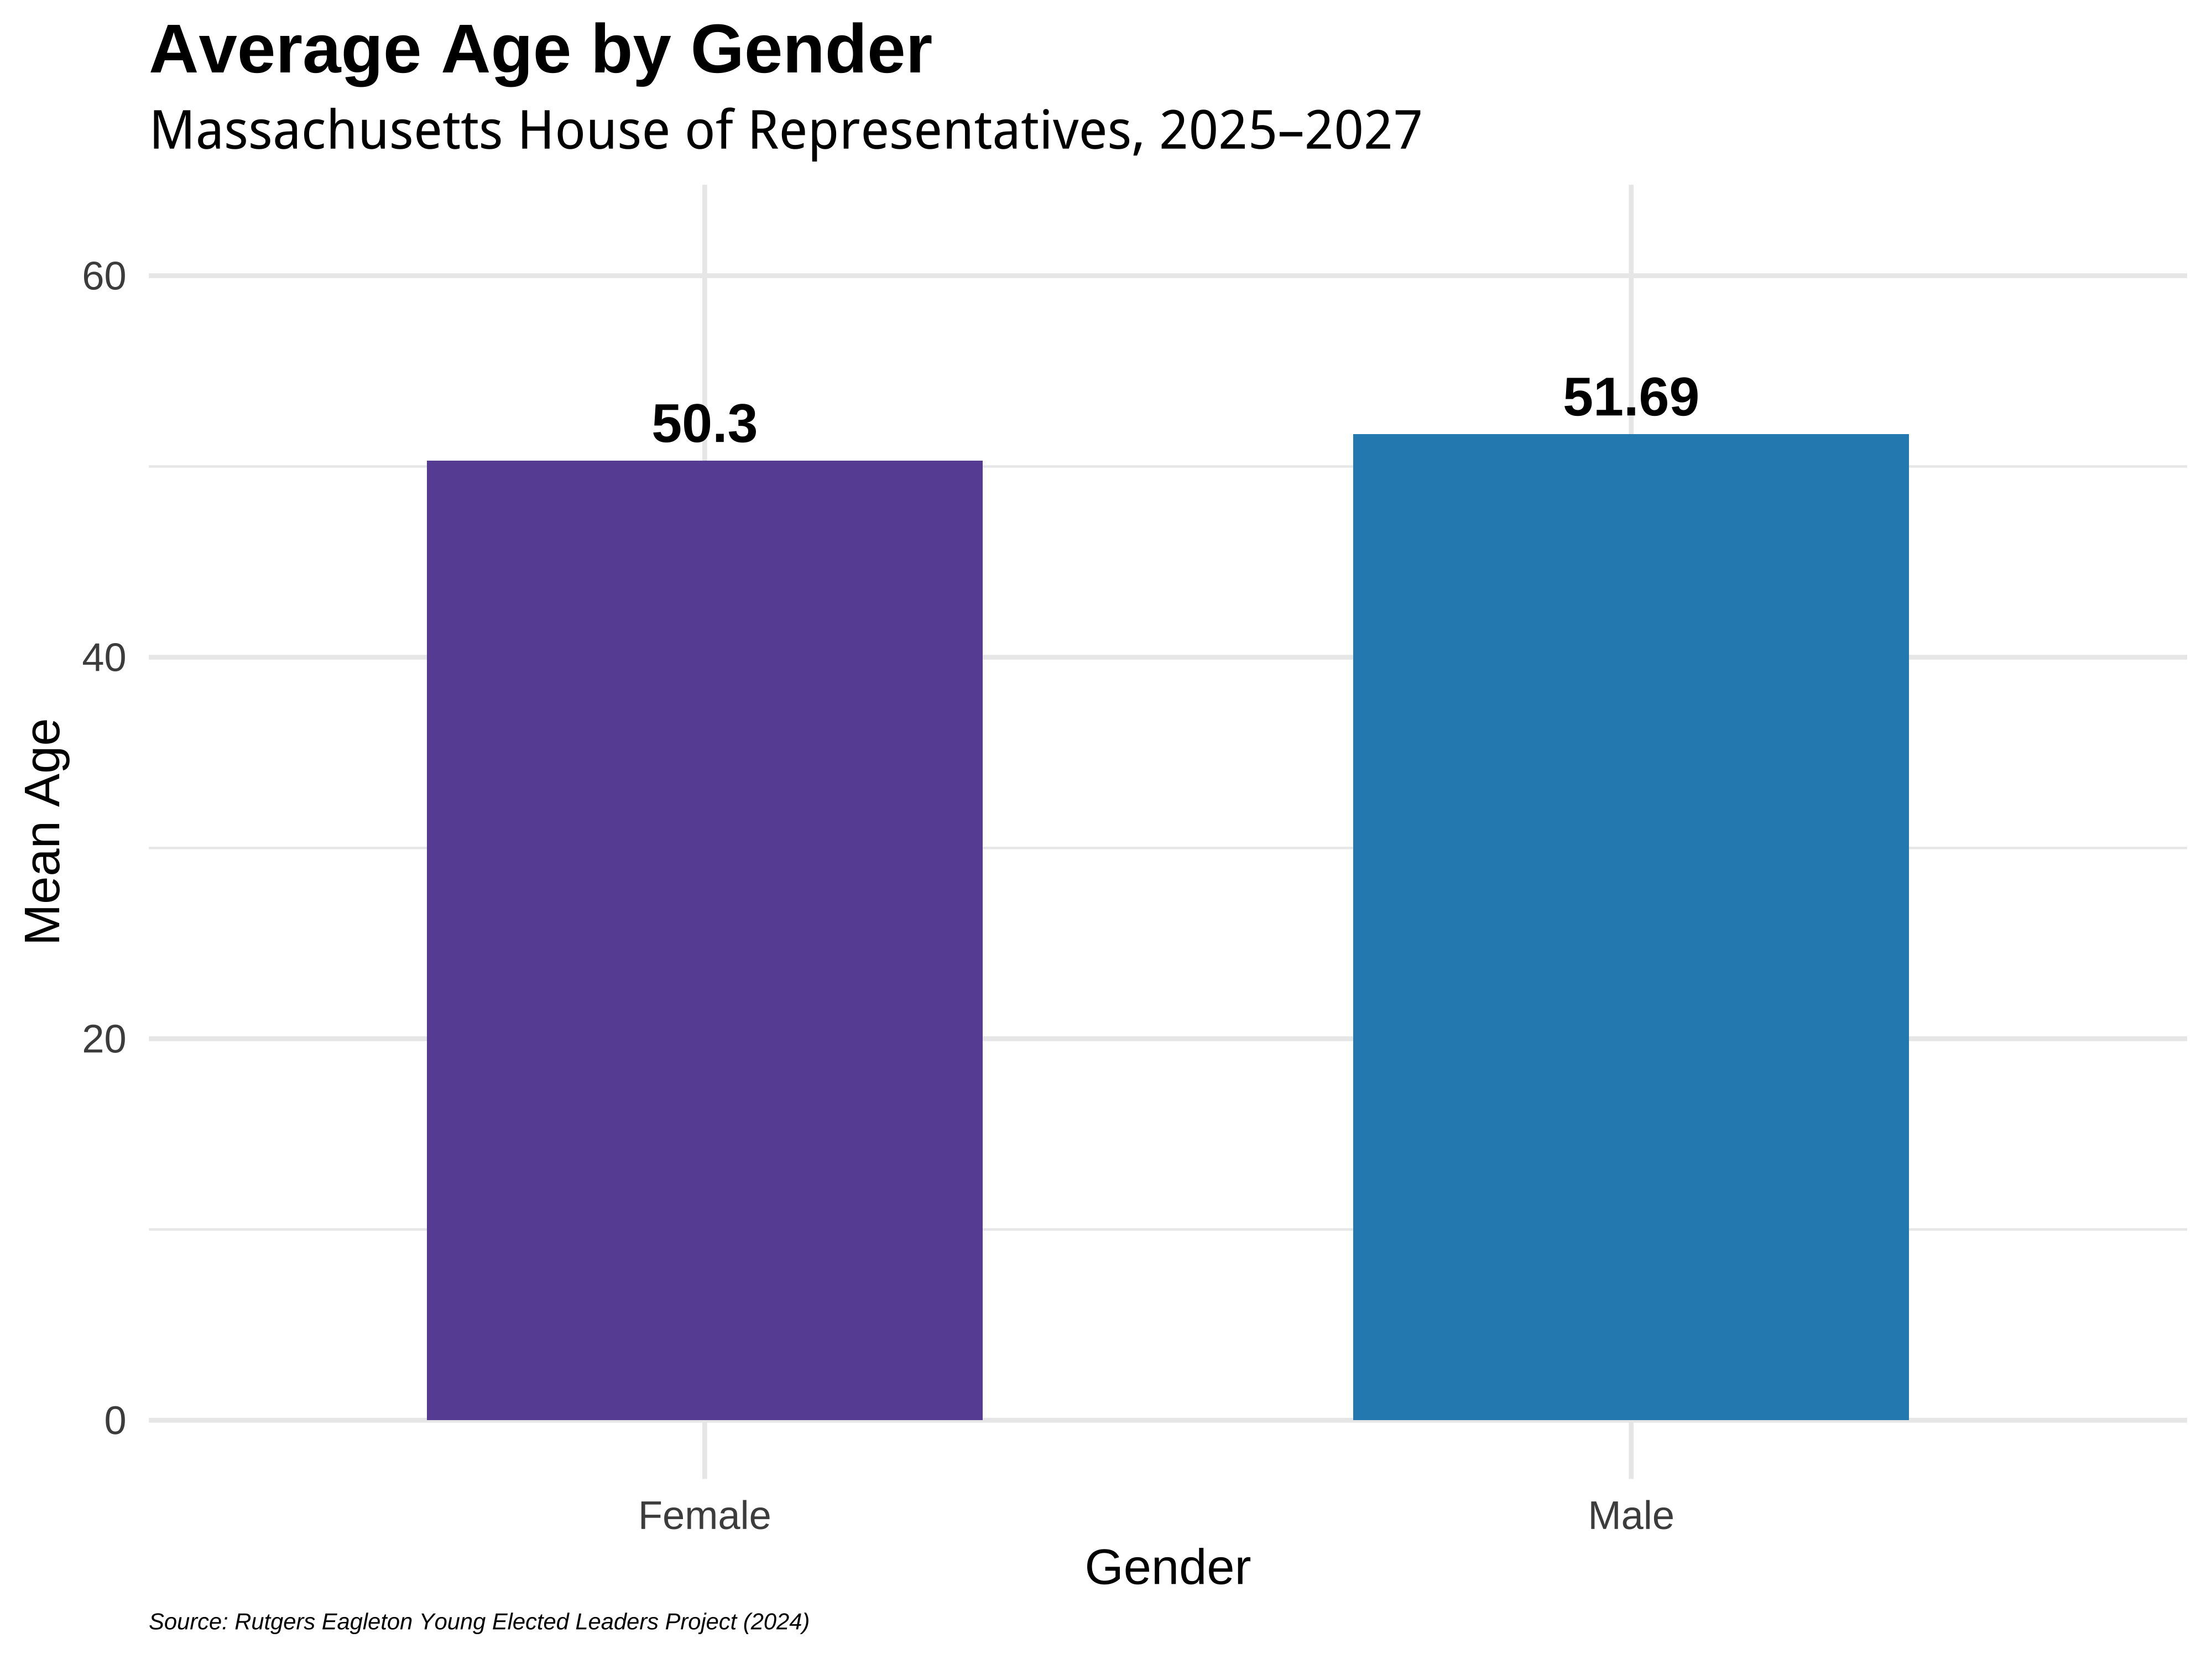
Gender in the Massachusetts House of Representatives
The Massachusetts House of Representatives reflects a range of age and gender dynamics that help shape the composition of the state’s legislative body. Across all members, 68.12% are men, while women make up the remaining 31.25%. Men have a higher mean age than women with the current Massachusetts House. For male representatives there was an average age of 51.69 at the time of the election, compared to 50.3 for their female colleagues. Of the the 18 Young Elected Leaders, 13 are male and 5 are female.
When examining both gender and party affiliation, notable age differences emerge within the Massachusetts House of Representatives. Among women, Democrats have an average age of 50.26 and Republicans 49.32. Among men, the averages are similar, with Democratic men at 51.9 and Republican men at 50.9. Across all gender–party combinations, the average age exceeds 49. These patterns show how age representation in the Massachusetts House varies by both gender and party, reflecting different pathways to political office across demographic groups.
* Two House members ages are currently missing, and one House seats remains vacant.
Race and Ethnicity in the Massachusetts House of Representatives
The racial and ethnic composition of the Massachusetts House varies across generations. In 2024, younger cohorts show more diversity, though the chamber overall remains majority White. The table below shows each generation’s distribution.
Generations by Race/Ethnicity in the Massachusetts House of Representatives
| Ethnicity | Generation Z 1997 – |
Millennial Generation 1981 – 1996 |
Generation X 1965 – 1980 |
Boomer Generation 1946 – 1964 |
Silent Generation 1928 – 1945 |
Full Chamber |
|---|---|---|---|---|---|---|
| White/Caucasian | 1 (50%) | 32 (68.09%) | 57 (87.69%) | 37 (88.1%) | 1 (100%) | 128 (81.53%) |
| Hispanic/Latino | – | 9 (19.15%) | 3 (4.62%) | 2 (4.76%) | – | 14 (8.92%) |
| Asian/Pacific American | 1 (50%) | 2 (4.26%) | 2 (3.08%) | 2 (4.76%) | – | 7 (4.46%) |
| Black/African American | – | 4 (8.51%) | 2 (3.08%) | 1 (2.38%) | – | 7 (4.46%) |
| Two or More Ethnicities | – | – | 1 (1.54%) | – | – | 1 (0.64%) |
| Total | 2 (1.27%) | 47 (29.94%) | 65 (41.4%) | 42 (26.75%) | 1 (0.64%) | 157 (100%) |
* Two House members’ ages are currently missing, and one House seat remains vacant. The full Massachusetts House of Representatives is comprised of 160 seats.
The Massachusetts Senate
Below is information covering age dynamics in the recently elected Massachusetts State Senate.
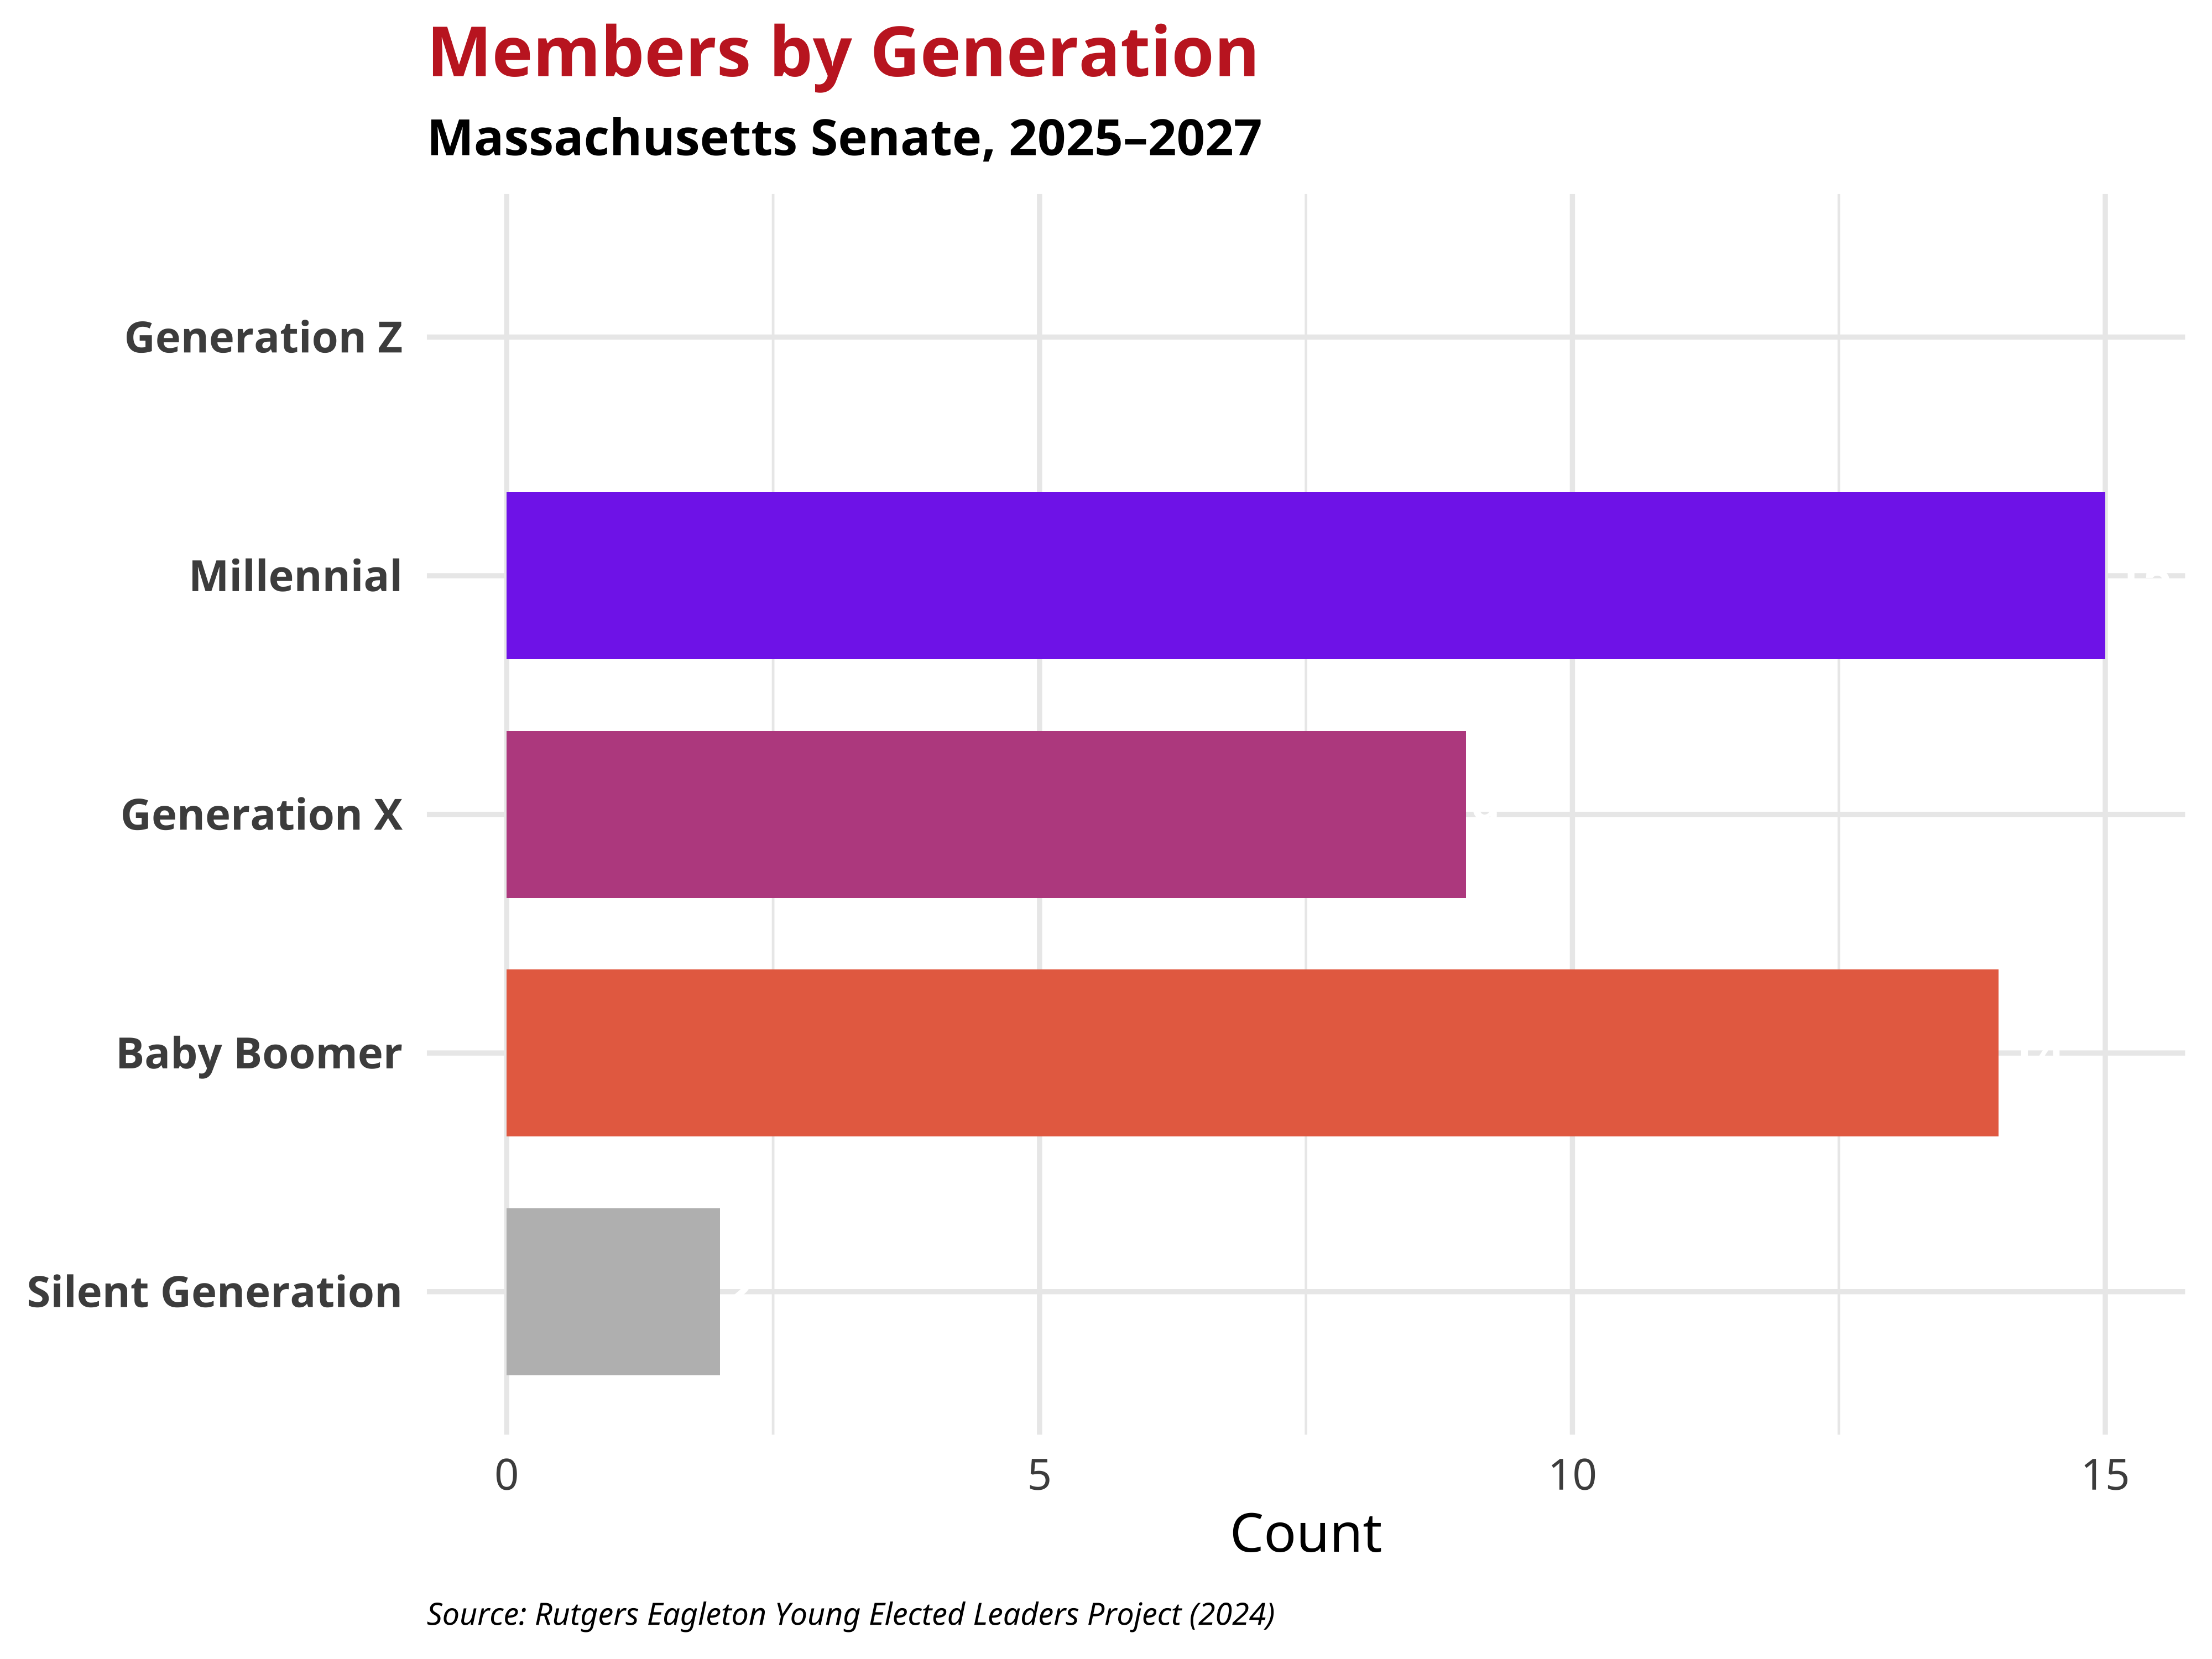
- the average age of Massachusetts State Senate members is 53.26 years
- the youngest Senator is Kelly Dooner who was born in 1992
- the oldest Senator is Cynthia Cream who was born in 1942
- 3 members of the Massachusetts State Senate are Young Elected Leaders, aged 35 or younger as of Election Day 2024
Young Elected Senators in the Massachusetts State Senate
Following the 2024 State Legislative Elections in Massachusetts, three members aged 35 or under were elected to the Massachusetts State Senate. Below is information about their local districts and party affiliation.
| Name | District | Birth Year
(Age on Election Day) |
Year First Elected to the
Massachusetts State Senate |
|
|---|---|---|---|---|
 |
Kelly A. Dooner (R) | 36th District –
Taunton, MA |
1992 (Age 32) | 2024 |
 |
John J. Cronin (D) | 10th District –
Lunenburg, MA |
1990 (Age 34) | 2020 |
 |
Dylan A. Fernandes (D) | 39th District –
Falmouth, MA |
1989 (Age 35) | 2024 |
Photos courtesy of the Massachusetts State Senate member roster.
Partisanship in the Massachusetts State Senate
In the Massachusetts State Senate, 35 senators belong to the Democratic Party, 5 senators are Republicans. The mean age of Democratic state senators after the 2024 election was 54.19, while the mean age of Republican state senators was 46.73. Each generation had a different partisan makeup. Below is the breakdown of party composition for each generation within the Massachusetts State Senate.

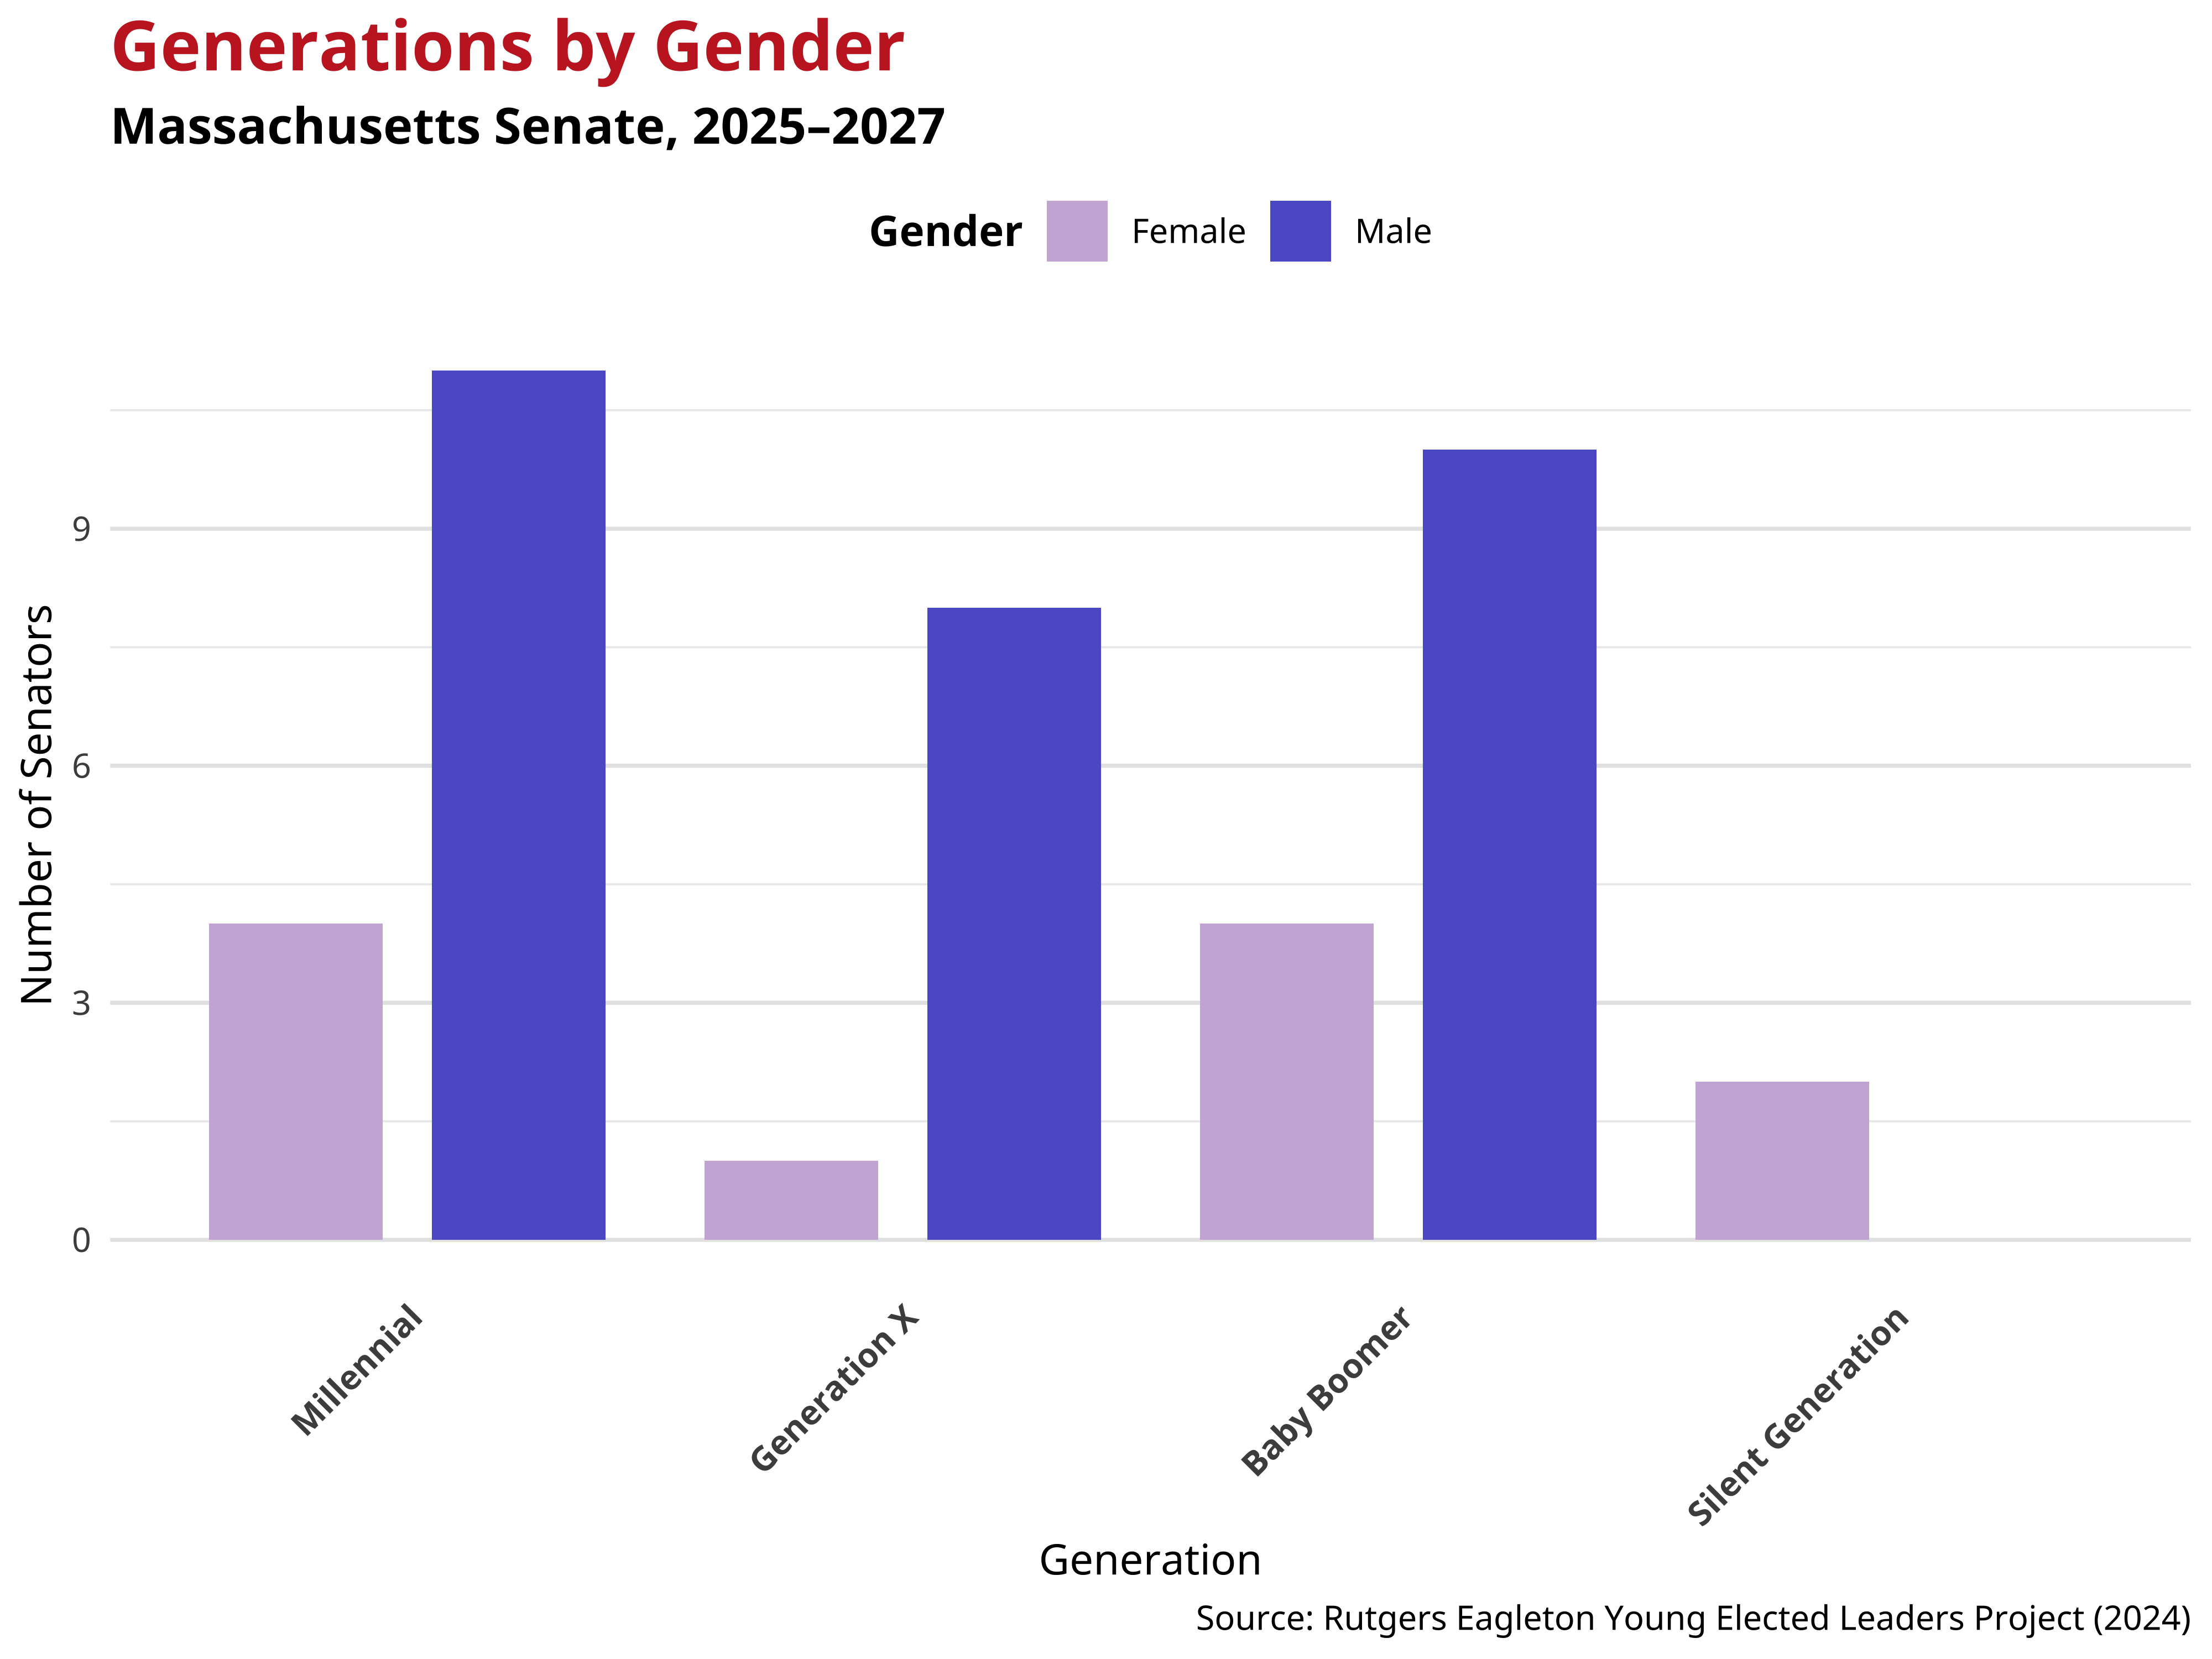
Gender in the Massachusetts Senate
The generational makeup of the Massachusetts Senate reveals notable gender dynamics. Overall, men outnumber women, across Millennial, Generation X, Baby Boomer senators. These patterns indicate that gender representation varies across generations, with women present in every age cohort but often in smaller numbers than men.
Race and Ethnicity in the Massachusetts Senate
The racial and ethnic composition of the Massachusetts Senate shows generational variation. The table below presents the distribution by generation.
Generations by Race/Ethnicity in the Massachusetts State Senate
| Millennial Generation | Generation X | Boomer Generation | Silent Generation | Full Chamber | |
|---|---|---|---|---|---|
| White/Caucasian | 10 (66.67%) | 9 (100%) | 13 (92.86%) | 2 (100%) | 34 (85%) |
| Hispanic/Latino | 4 (26.67%) | – | 1 (7.14%) | – | 5 (12.5%) |
| Black/African American | 1 (6.67%) | – | – | – | 1 (2.5%) |
| Total | 15 (37.5%) | 9 (22.5%) | 14 (35%) | 2 (5%) | 40 (100%) |
The full Massachusetts State Senate is comprised of 40 seats.
Notes
The Young Elected Leaders Project applies the generational categorization of the Pew Research Center:
- Silent Generation: 1928 – 1945
- Baby Boomer Generation: 1946 – 1964
- Generation X: 1965 – 1980
- Millennial Generation: 1981 – 1996
- Generation Z: 1997 – 2012
This analysis is based on data from the most recent state legislative election in Massachusetts which took place on November 5th 2024.
Citation Guideline
In referencing the Young Elected Leaders Project in publication please use the following language: “The Young Elected Leaders Project is housed at the Center for Youth Political Participation at The Eagleton Institute of Politics, Rutgers University – New Brunswick.”
Bibliographic Citation For this document
Author: Young Elected Leaders Project
Corresponding Authors: George D. Quinn
Year: 2024
Title: Age in the 2025 Massachusetts General Court