Age in the 2025 Pennsylvania General Assembly
The State of Pennsylvania held its elections for a new Pennsylvania House of Representatives and Pennsylvania State Senate on November 4th, 2024. In January 2025, the currently active 2025 legislative session of the Pennsylvania House of Representatives. Among the members elected, 28 were aged 35 or younger on the day of the 2024 election. Below is a map of these representatives within both chambers of the Pennsylvania General Assembly.
Pennsylvania Demographic Background in the 2024 Election
Preliminary estimates from CIRCLE at Tufts University indicate that 42% of young people aged 18–29 voted in the 2024 election, with turnout surpassing 50% in key battleground states. Nearly 50 million young citizens were eligible to vote nationwide, including over 8 million who turned 18 since the 2022 midterms.
According to the Pew Research Center, Millennials surpassed Baby Boomers in 2020 to become the largest generation in the U.S., making up 31% of the population, followed closely by Boomers at 30.9%. Generation X accounts for 28%, while the Silent Generation makes up just 9.9%.
The 2024 elections in Pennsylvania were hotly contested, as the state was considered one of the critical seven battleground states in the presidential race. According to the Youth Electoral Significance Index (YESI), Pennsylvania ranked 3rd among states most affected by youth political participation in the 2024 presidential election. In addition, the Senate race in Pennsylvania was ranked the 7th most important given its competitive electoral status and large youth population. Several competitive House elections also occurred in PA. Many House races in Pennsylvania ranked high in the YESI scale, especially the contentious race in Pennsylvania’s 1st, 7th, 8th, 10th, & 17th congressional districts.
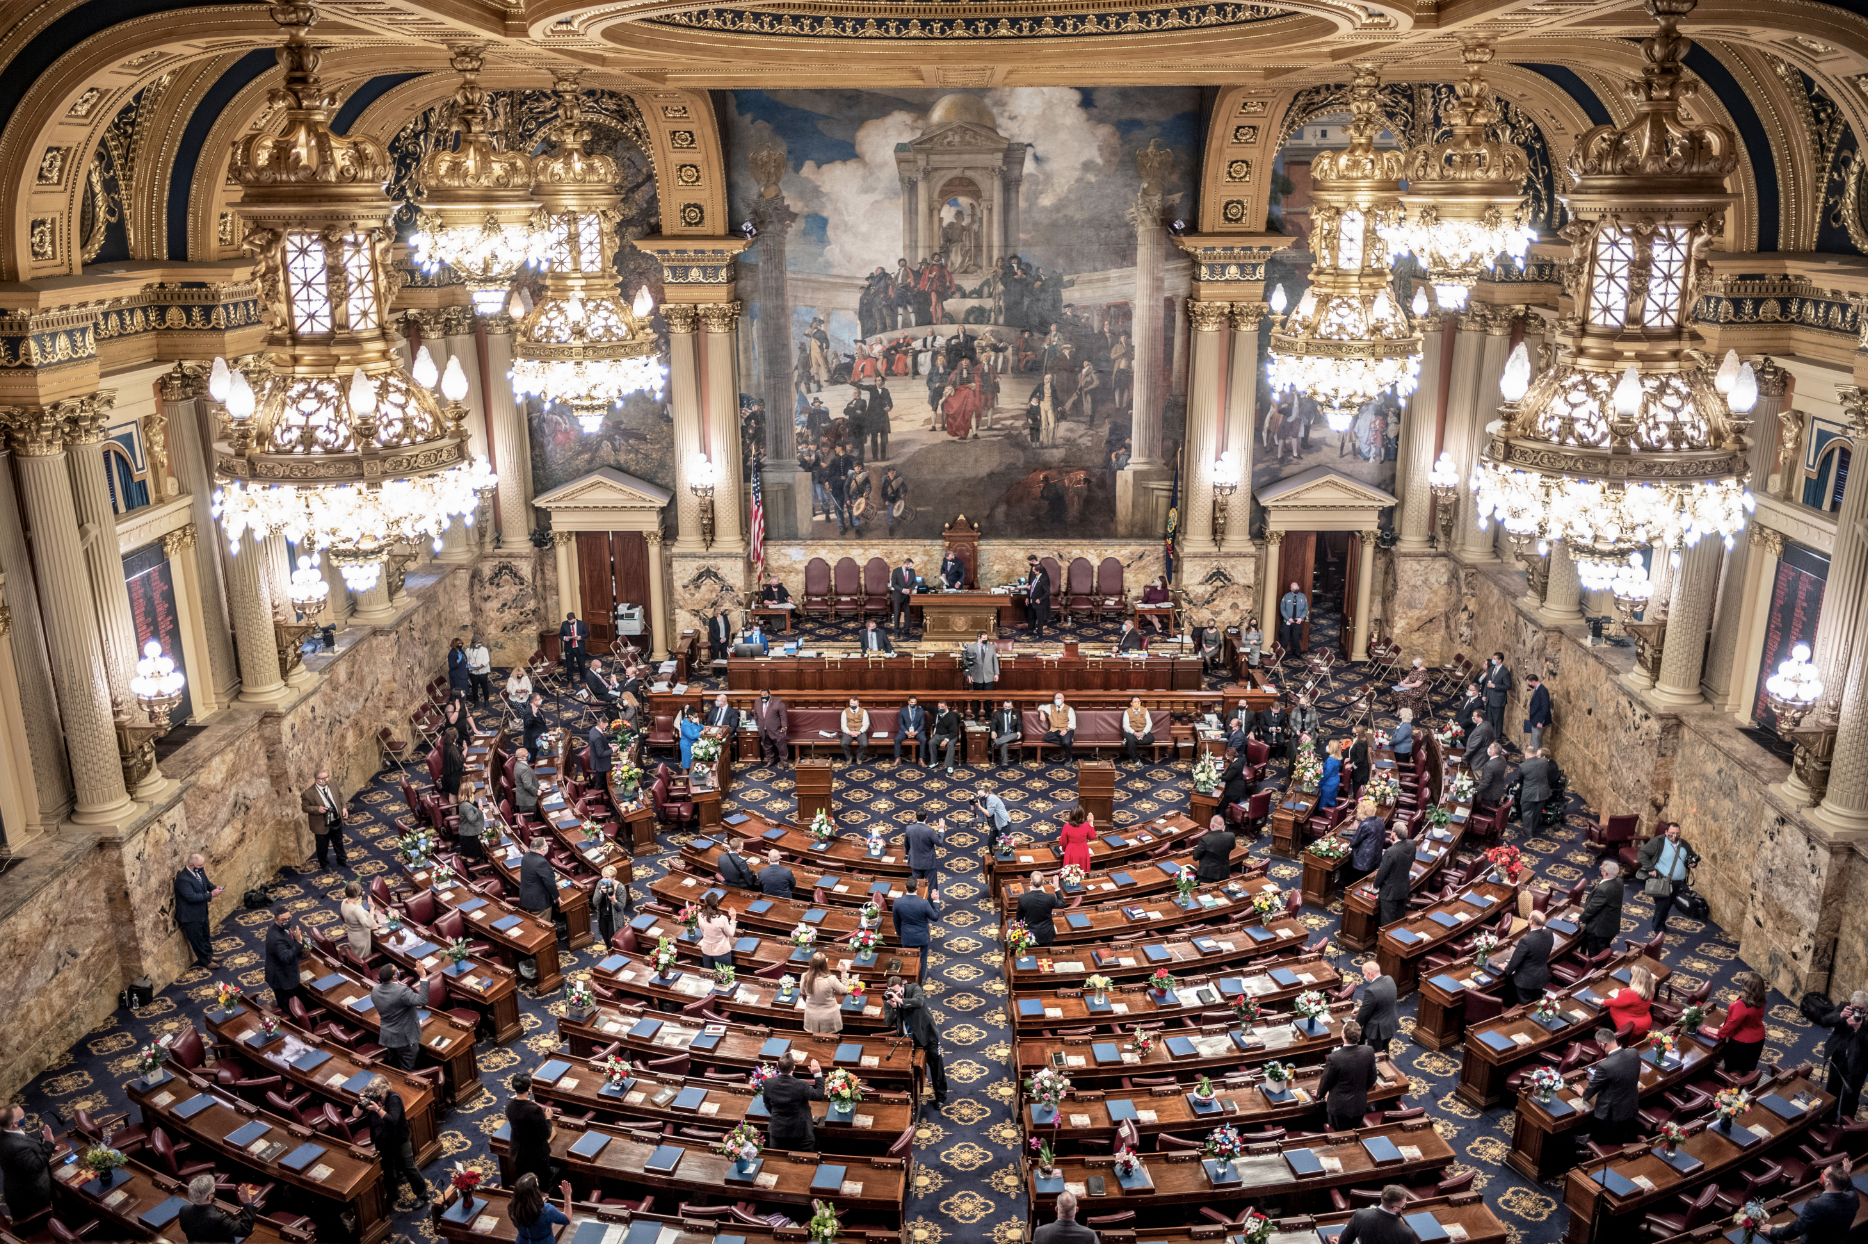
The Pennsylvania House of Representatives 2025 Legislative Session
Below is information covering age dynamics in the recently elected members of the Pennsylvania House of Representatives
- The average age among Pennsylvania House members was 50.64 years
- The youngest Representative, Alec Joseph Ryncavage, was born in 2001
- The oldest Representative, Tina L. Pickett, was born in 1943
- 24 Representatives are Young Elected Leaders age 35 or younger as of Election Day 2024
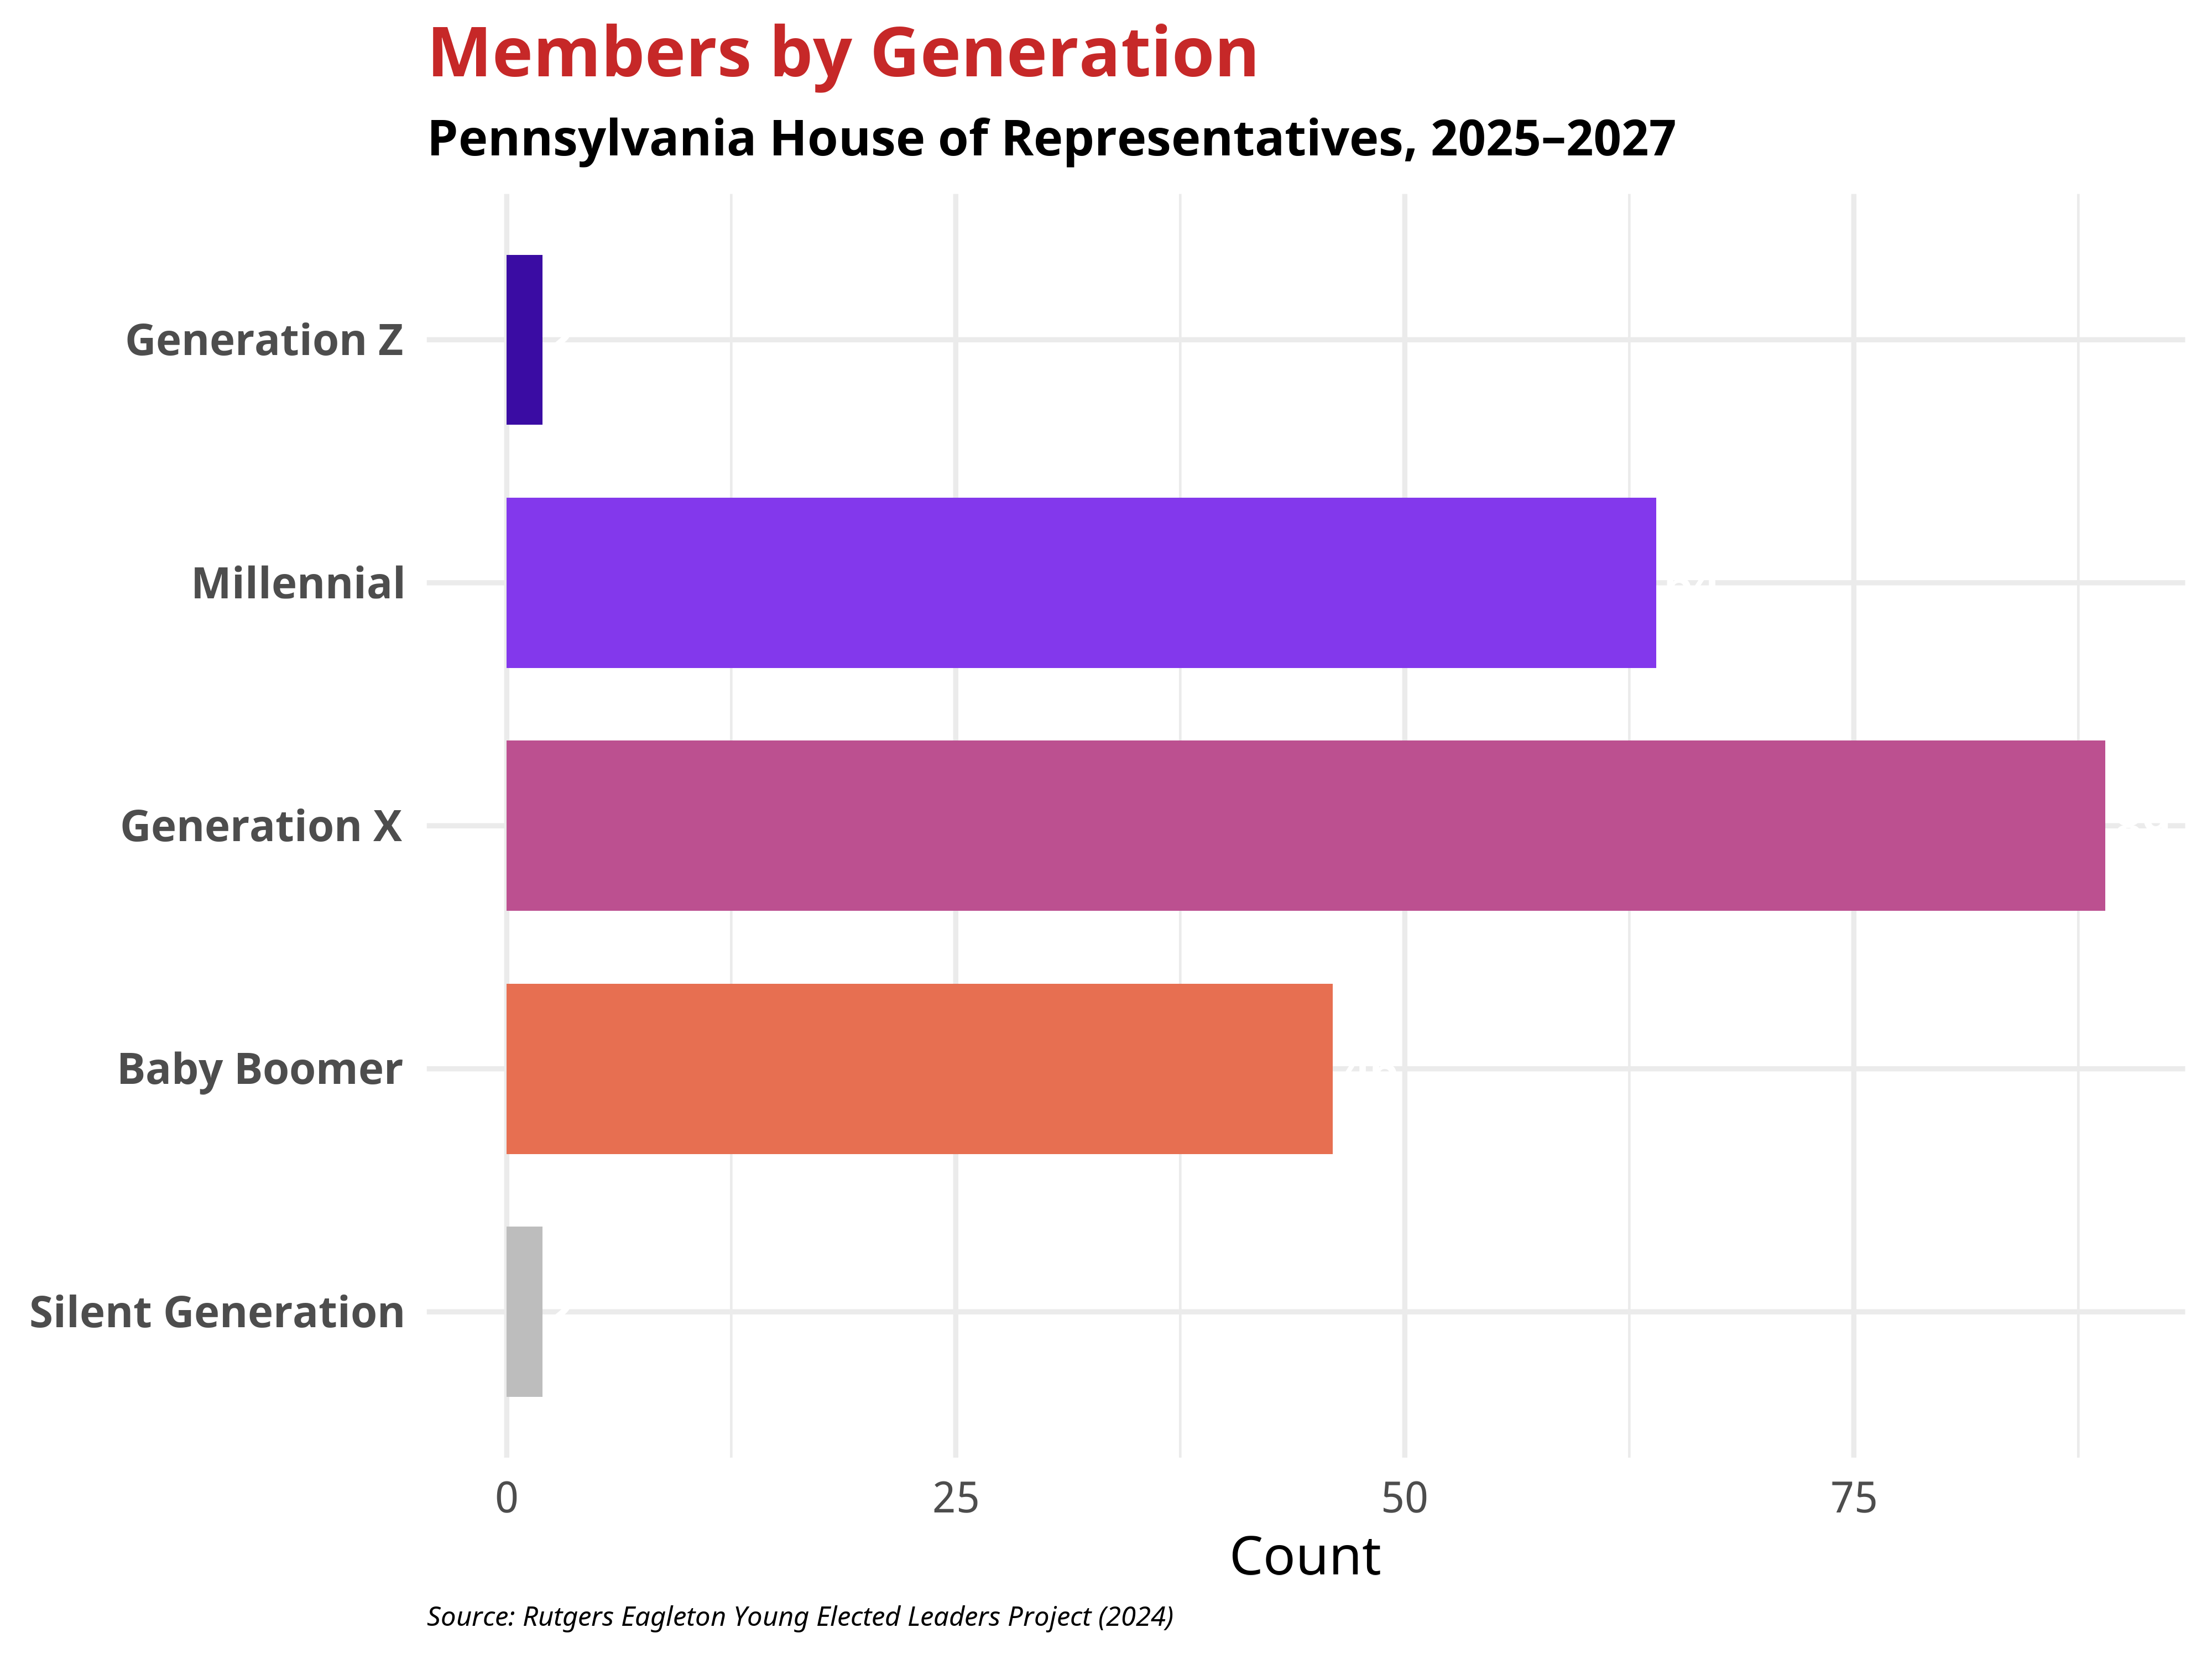
Generational Breakdown
Within the Pennsylvania House of Representatives, most representatives come from the Millennial, Generation X, or the Baby Boomer generations. Scroll below to view the generations represented in the Pennsylvania House of Representatives.
Partisanship in the Pennsylvania House of Representatives
The chart below provides a further breakdown of the current partisan composition of the 2025 Pennsylvania House of Representatives. Each dot represents a single member, colored by both party affiliation and whether the legislator qualifies as a Young Elected Leader (YEL)—defined as age 35 or younger at the time of the election. This format provides a visual snapshot of generational and partisan distribution within the chamber, highlighting how younger legislators are positioned across party lines.
Partisan differences in the Pennsylvania House extend beyond ideology to include notable generational contrasts. As shown in the visual below, Republican legislators have a higher average age than their Democratic counterparts—51.54 years compared to 49.75 years—a gap of 1.79 years. These disparities may reflect broader patterns in political recruitment, generational turnover, and the types of candidates emerging in recent election cycles. However, PAs’ disparity between average ages by party is noticeably smaller than others.

Young Elected Representatives – Pennsylvania House of Representatives
Following the 2024 State Legislative Elections in Pennsylvania, 28 members aged 35 or under were elected to the Pennsylvania House of Representatives. Below are all nine members, ordered from youngest to oldest, along with information about their local districts and party affiliations.
Young Elected Representatives — Pennsylvania House of Representatives (Age ≤ 35)
| Name | District | Birth Year (Age) | First Elected | |
|---|---|---|---|---|
 |
Alec Joseph Ryncavage (R) | District 119 — Plymouth, PA | 2001 (Age 23) | 2022 |
 |
Andrew M. Kuzma (R) | District 39 — Elizabeth Township, PA | 1997 (Age 27) | 2022 |
 |
Dallas Paul Kephart (R) | District 73 — Osceola Mills, PA | 1996 (Age 28) | 2022 |
 |
Thomas H. Kutz (R) | District 87 — Harrisburg, PA | 1994 (Age 30) | 2022 |
 |
Sean Michael Dougherty (D) | District 172 — Philadelphia, PA | 1994 (Age 30) | 2024 |
 |
Carol Kazeem (D) | District 159 — Chester, PA | 1992 (Age 32) | 2022 |
 |
Chad G. Reichard (R) | District 90 — Waynesboro, PA | 1992 (Age 32) | 2024 |
 |
Jessica Lynn Benham (D) | District 36 — Pittsburgh, PA | 1990 (Age 33) | 2020 |
 |
Richard Chester Krajewski (D) | District 188 — Philadelphia, PA | 1991 (Age 33) | 2020 |
 |
Jennifer M. O’Mara (D) | District 165 — Springfield, PA | 1989 (Age 33) | 2018 |
 |
Lindsay Powell (D) | District 21 — Pittsburgh, PA | 1991 (Age 33) | 2023 |
 |
Joshua M. Siegel (D) | District 22 — Allentown, PA | 1993 (Age 33) | 2022 |
 |
Malcolm Kenyatta (D) | District 181 — Philadelphia, PA | 1990 (Age 34) | 2018 |
 |
Anthony Andrew Bellmon (D) | District 203 — Philadelphia, PA | 1990 (Age 34) | 2022 |
 |
David H. Rowe (R) | District 85 — Lewisburg, PA | 1989 (Age 34) | 2019 |
 |
Nathan W. Davidson (D) | District 103 — Harrisburg, PA | 1989 (Age 35) | 2024 |
 |
Zachary Allen Mako (R) | District 183 — Walnutport, PA | 1988 (Age 35) | 2016 |
 |
Ismail Smith-Wade-El (D) | District 49 — Lancaster, PA | 1989 (Age 35) | 2022 |
Photos Courtesy of the Pennsylvania House member roster
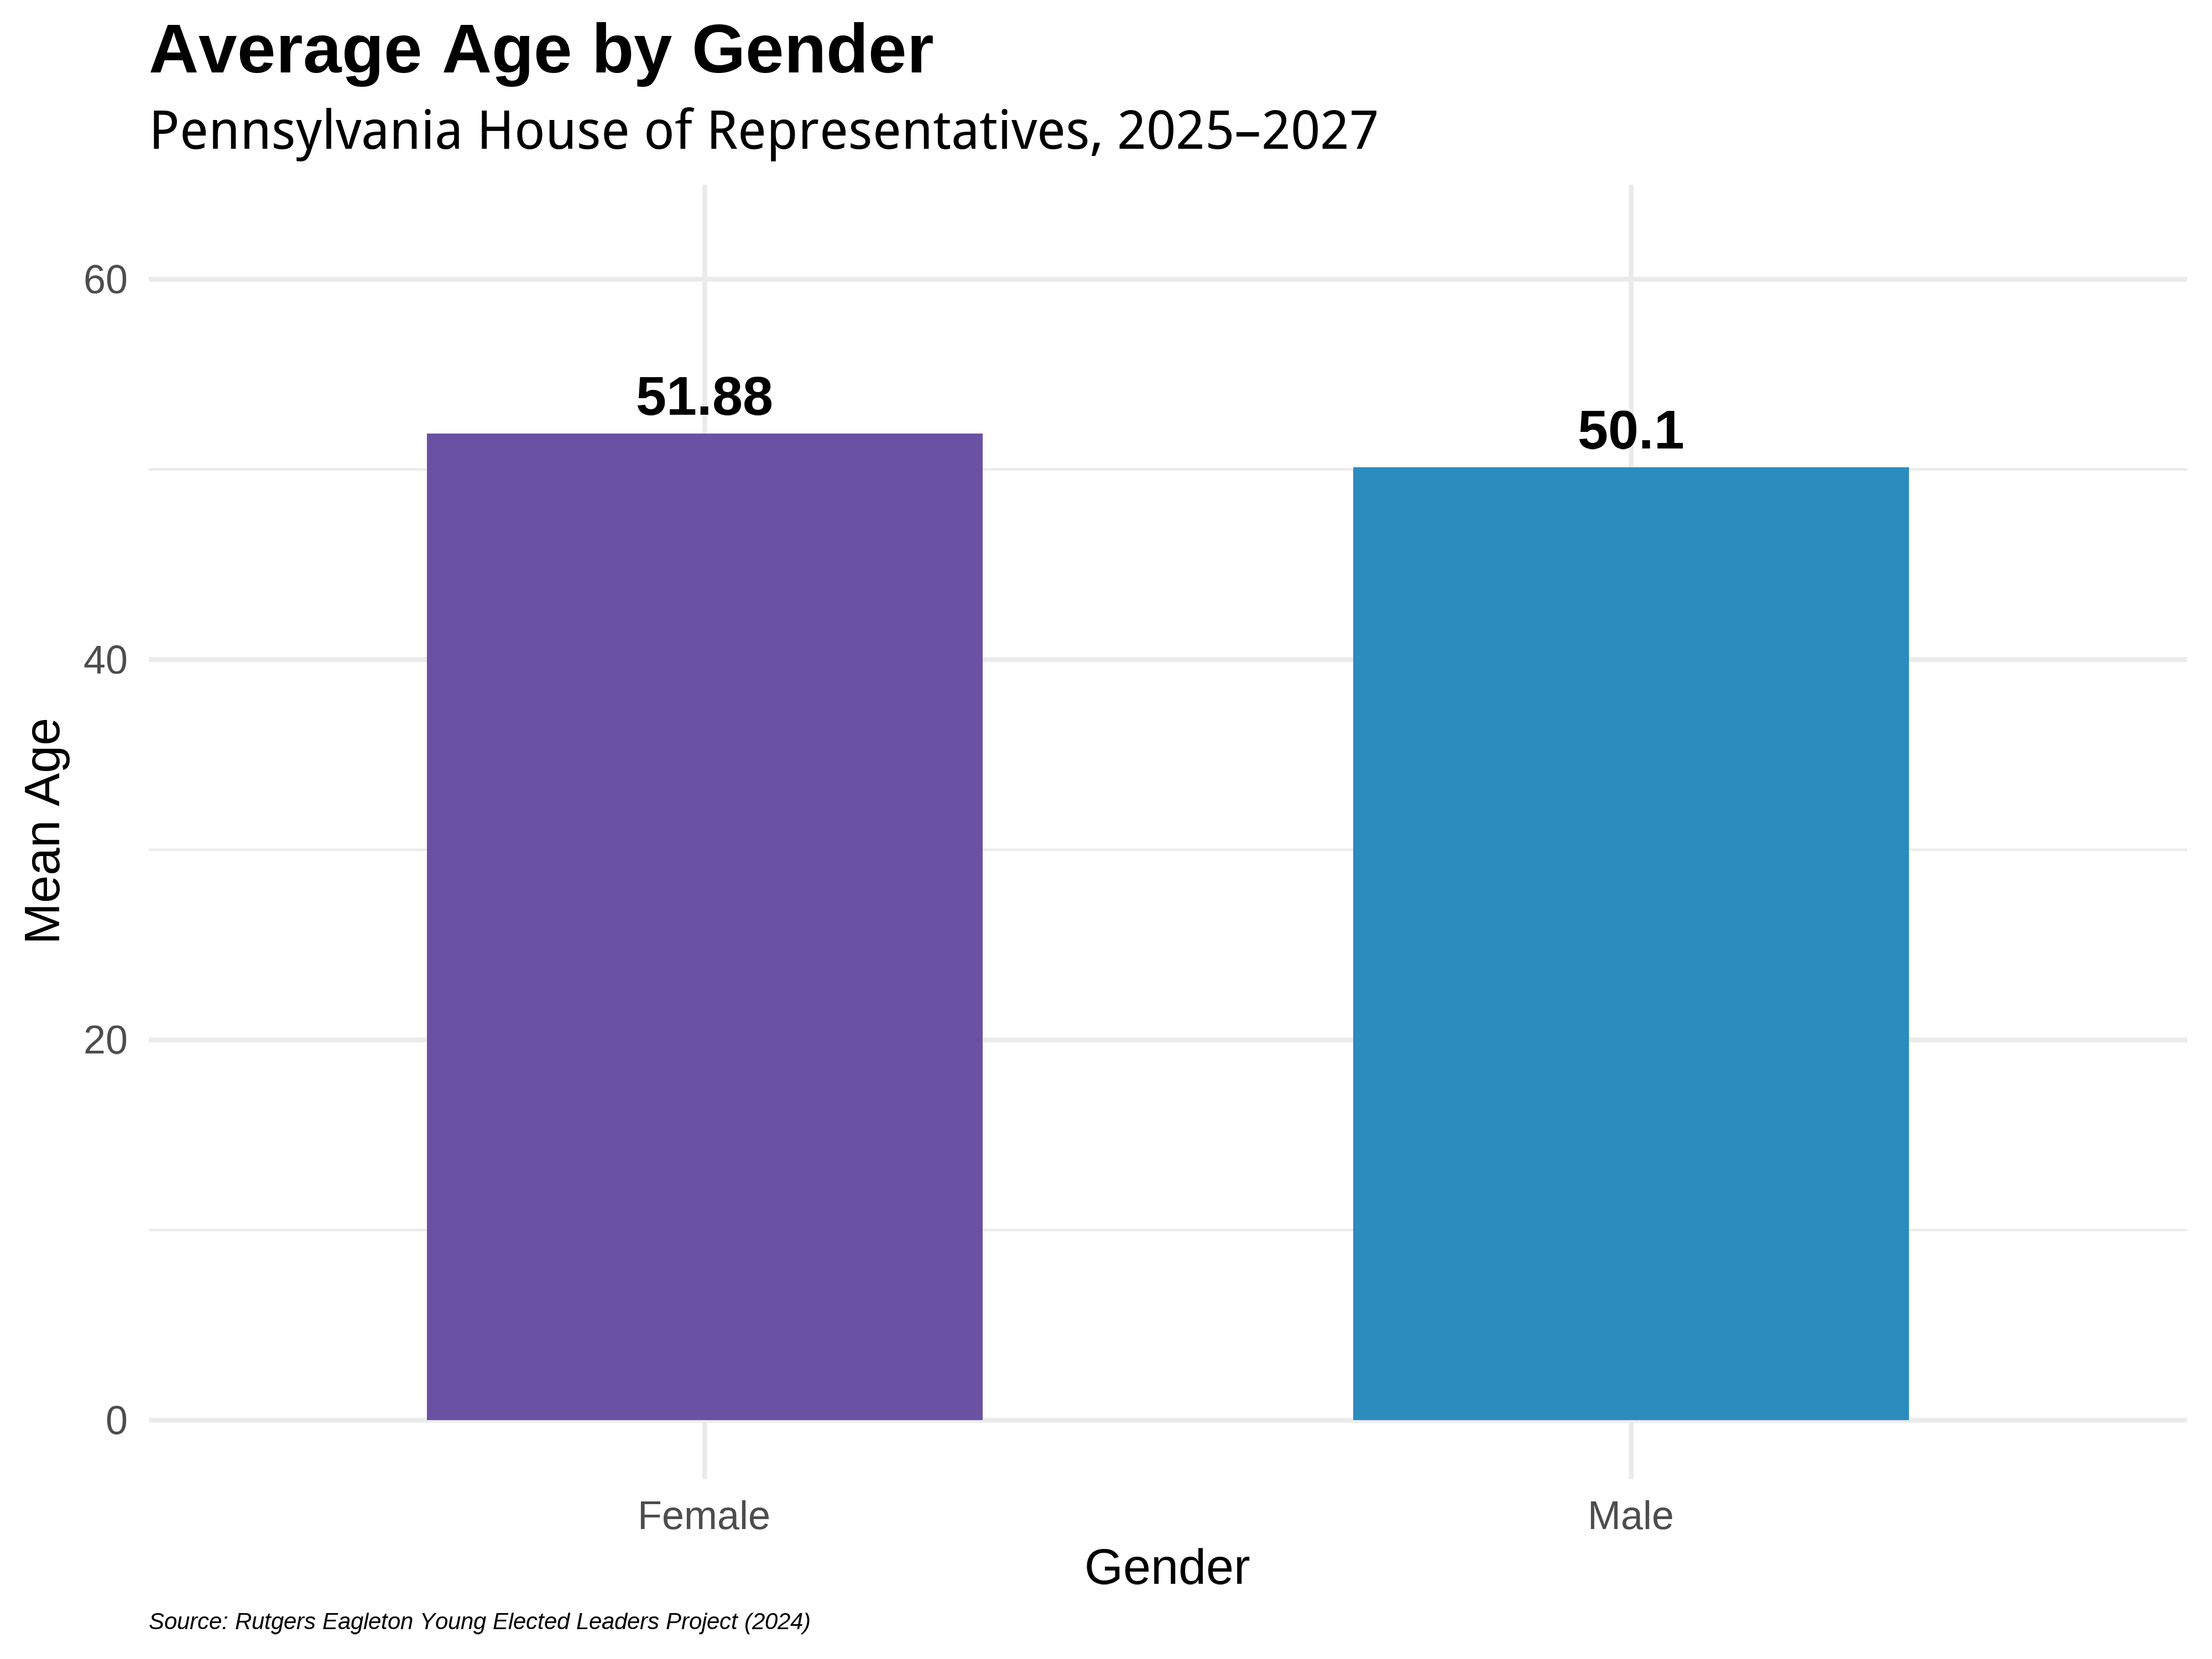
Gender in the Pennsylvania House of Representatives
The Pennsylvania House of Representatives reflects a range of age and gender dynamics that help shape the composition of the state’s legislative body. In Pennsylvania, men make up a larger share of the chamber than women. Across all members, 69.46% are men, while women make up 30.54%. Although men are in the majority, Pennsylvania has much higher gender parity than other states. For female representatives, the average age at the time of the election was 51.88; for men, it was 50.1. Of the 24 Young Elected Leaders, 5 are female, and 19 are male.
When examining both gender and party affiliation, additional age differences emerge within the Pennsylvania House of Representatives. Republican men and women have a higher average age when compared to Democrats. These patterns show that age representation in the Pennsylvania House of Representatives varies by both gender and partisan alignment, highlighting differing pathways to political office across demographic groups.

Race and Ethnicity in the Pennsylvania House of Representatives
The racial and ethnic composition of the Pennsylvania House of Representatives varies across generations. In 2024, younger cohorts exhibit greater diversity, although the chamber as a whole remains predominantly White. The table below shows the distribution of each generation.
Generations by Race/Ethnicity in the Pennsylvania House of Representatives
| Ethnicity | Generation Z 1997–2012 |
Millennial Generation 1981–1996 |
Generation X 1965–1980 |
Boomer Generation 1946–1964 |
Silent Generation 1928–1945 |
Full Chamber |
|---|---|---|---|---|---|---|
| White / Caucasian | 2 (100%) | 48 (75%) | 77 (86.52%) | 42 (91.30%) | 2 (100%) | 171 (84.24%) |
| Black / African American | 0 (0%) | 14 (21.88%) | 7 (7.87%) | 4 (8.70%) | 0 (0%) | 25 (12.32%) |
| Hispanic / Latino | 0 (0%) | 1 (1.56%) | 3 (3.37%) | 0 (0%) | 0 (0%) | 4 (1.97%) |
| Two or More Ethnicities | 0 (0%) | 1 (1.56%) | 0 (0%) | 0 (0%) | 0 (0%) | 1 (0.49%) |
| Other | 0 (0%) | 0 (0%) | 2 (2.25%) | 0 (0%) | 0 (0%) | 2 (0.99%) |
| Total (Percent of Chamber) | 2 (0.99%) | 64 (31.53%) | 89 (43.84%) | 46 (22.66%) | 2 (0.99%) | 203 (100%) |
The full Pennsylvania House of Representatives comprises 203 seats.
The Pennsylvania Senate
Below is information covering age dynamics in the recently elected Pennsylvania Senate
- The average age of Pennsylvania State Senate members is 60.03 years
- The youngest Senator is Nicholas P. Miller, born in 1995
- The oldest Senator is Eugene Yaw, born in 1943
- 4 members of the Pennsylvania State Senate are Young Elected Leaders, aged 35 or younger as of Election Day 2024
Young Elected Senators in the Pennsylvania State Senate
Following the 2024 State Legislative Elections in Pennsylvania, four members aged 35 or under were elected to (and currently serve in) the Pennsylvania State Senate.
Young Elected Representatives — Pennsylvania State Senate (Age ≤ 35)
| Name | District | Birth Year (Age) | First Elected | |
|---|---|---|---|---|
 |
Nicholas P. Miller (D) | District 14 — Allentown, PA | 1995 (Age 29) | 2022 |
 |
Joseph Sam Picozzi (R) | District 5 — Philadelphia, PA | 1995 (Age 29) | 2024 |
 |
Nickolas R. Pisciottano (D) | District 45 — West Miffilin, PA | 1990 (Age 34) | 2024 |
 |
Jarrett Charles Coleman (R) | District 16 — Breinigsville, PA | 1990 (Age 34) | 2022 |
Photos courtesy of the Pennsylvania Senate Member Roster.
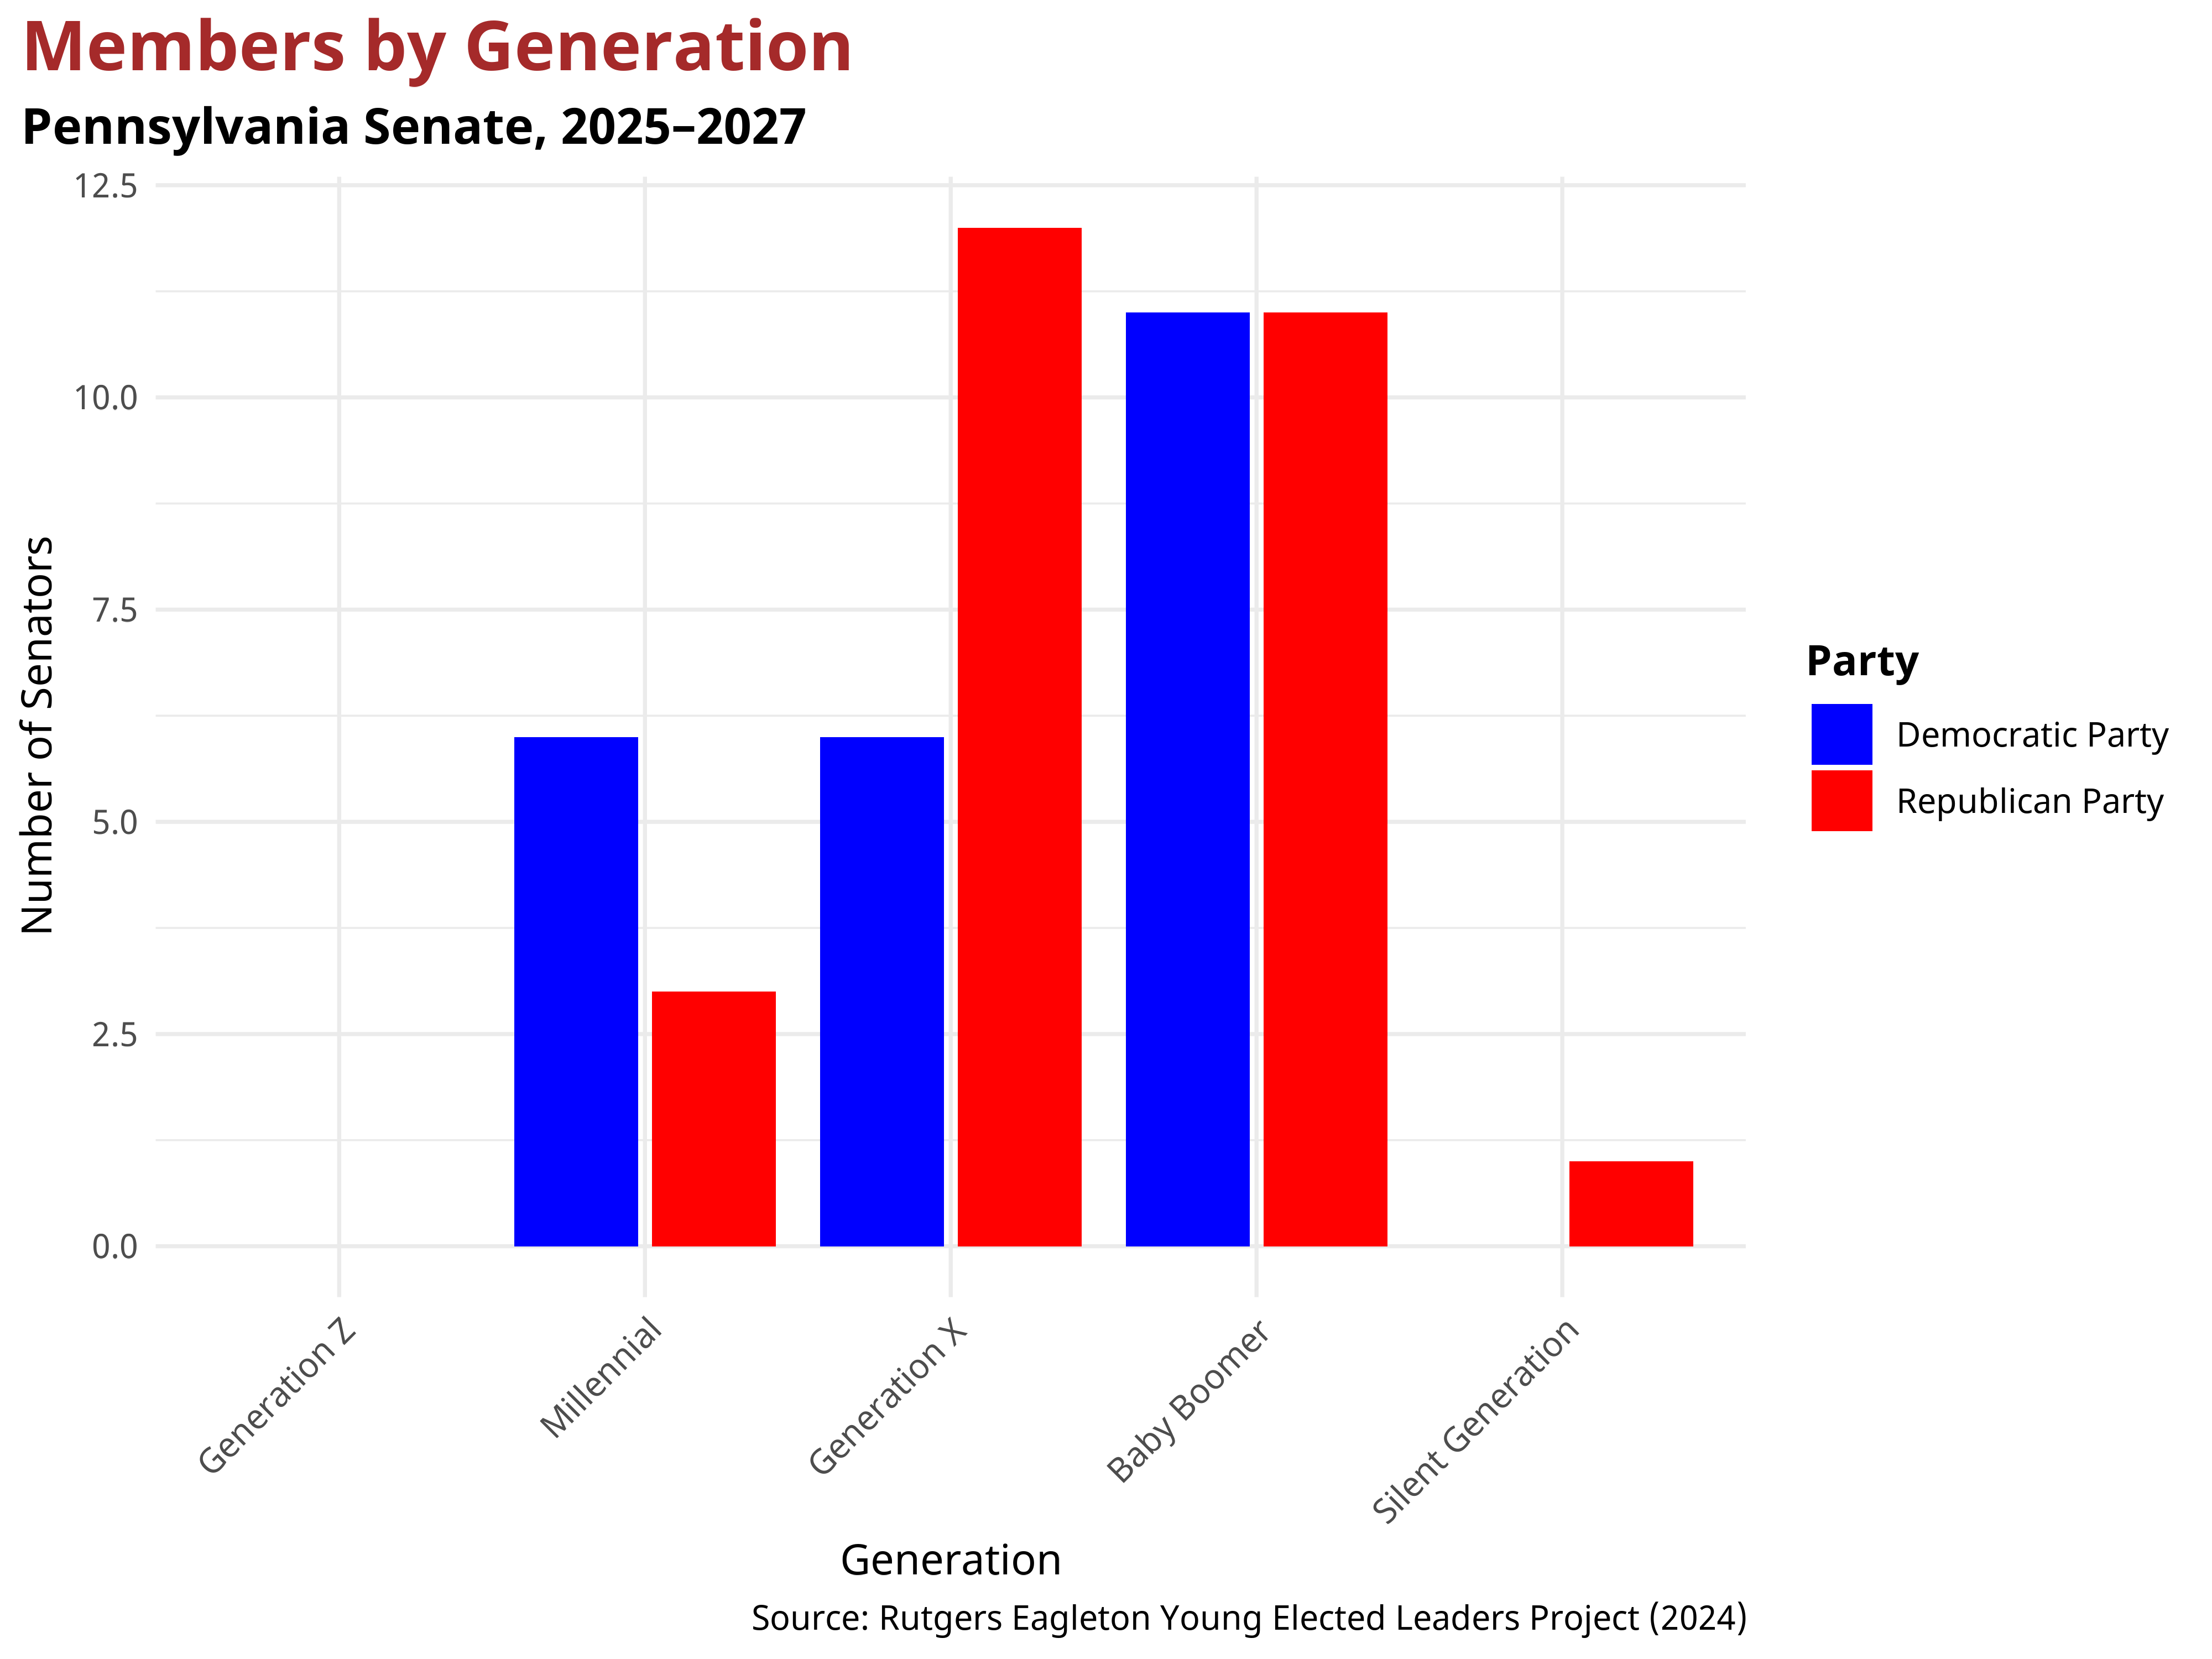
Partisanship in the Pennsylvania State Senate
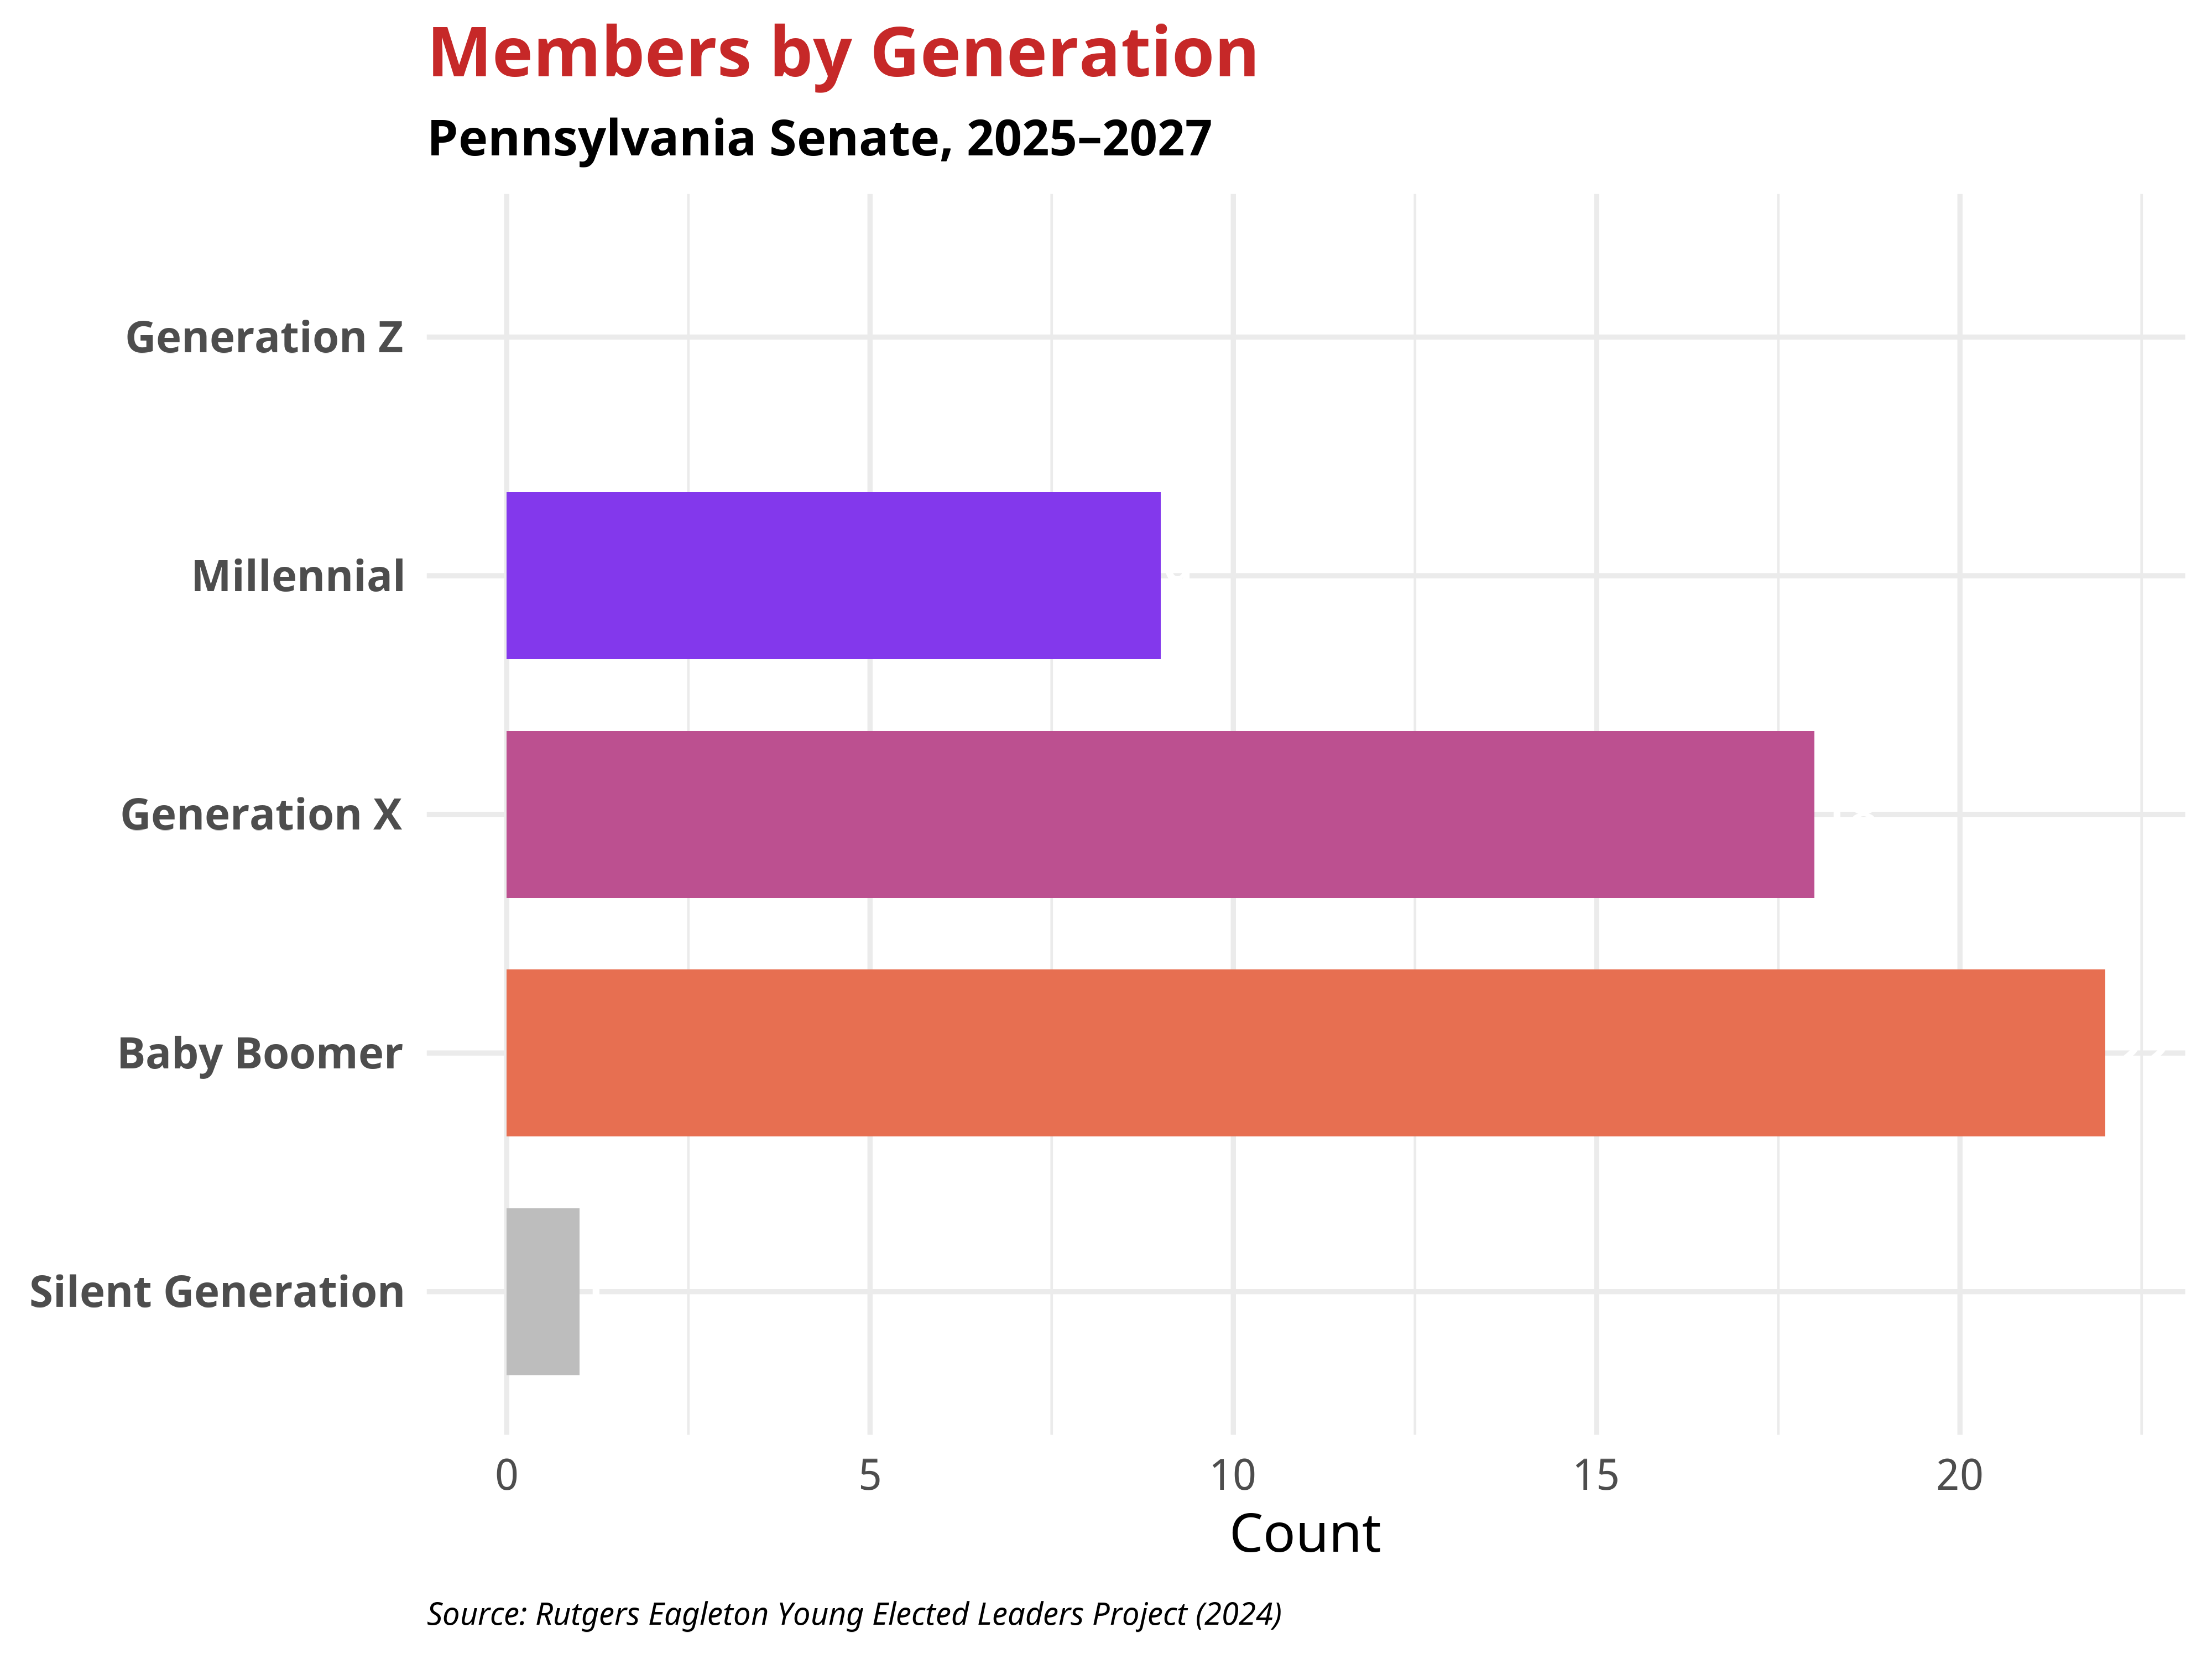
In the Pennsylvania State Senate, 27 senators belong to the Republican Party, and 24 senators are Democrats. The mean age of Republican state senators after the 2024 election was 56.78, while the mean age of Democratic state senators was 55.79. Each generation has a different partisan makeup; overall, the Pennsylvania State Senate is overwhelmingly composed of Baby Boomers and members of Generation X. Below is the breakdown of party composition by generation in the Pennsylvania State Senate.
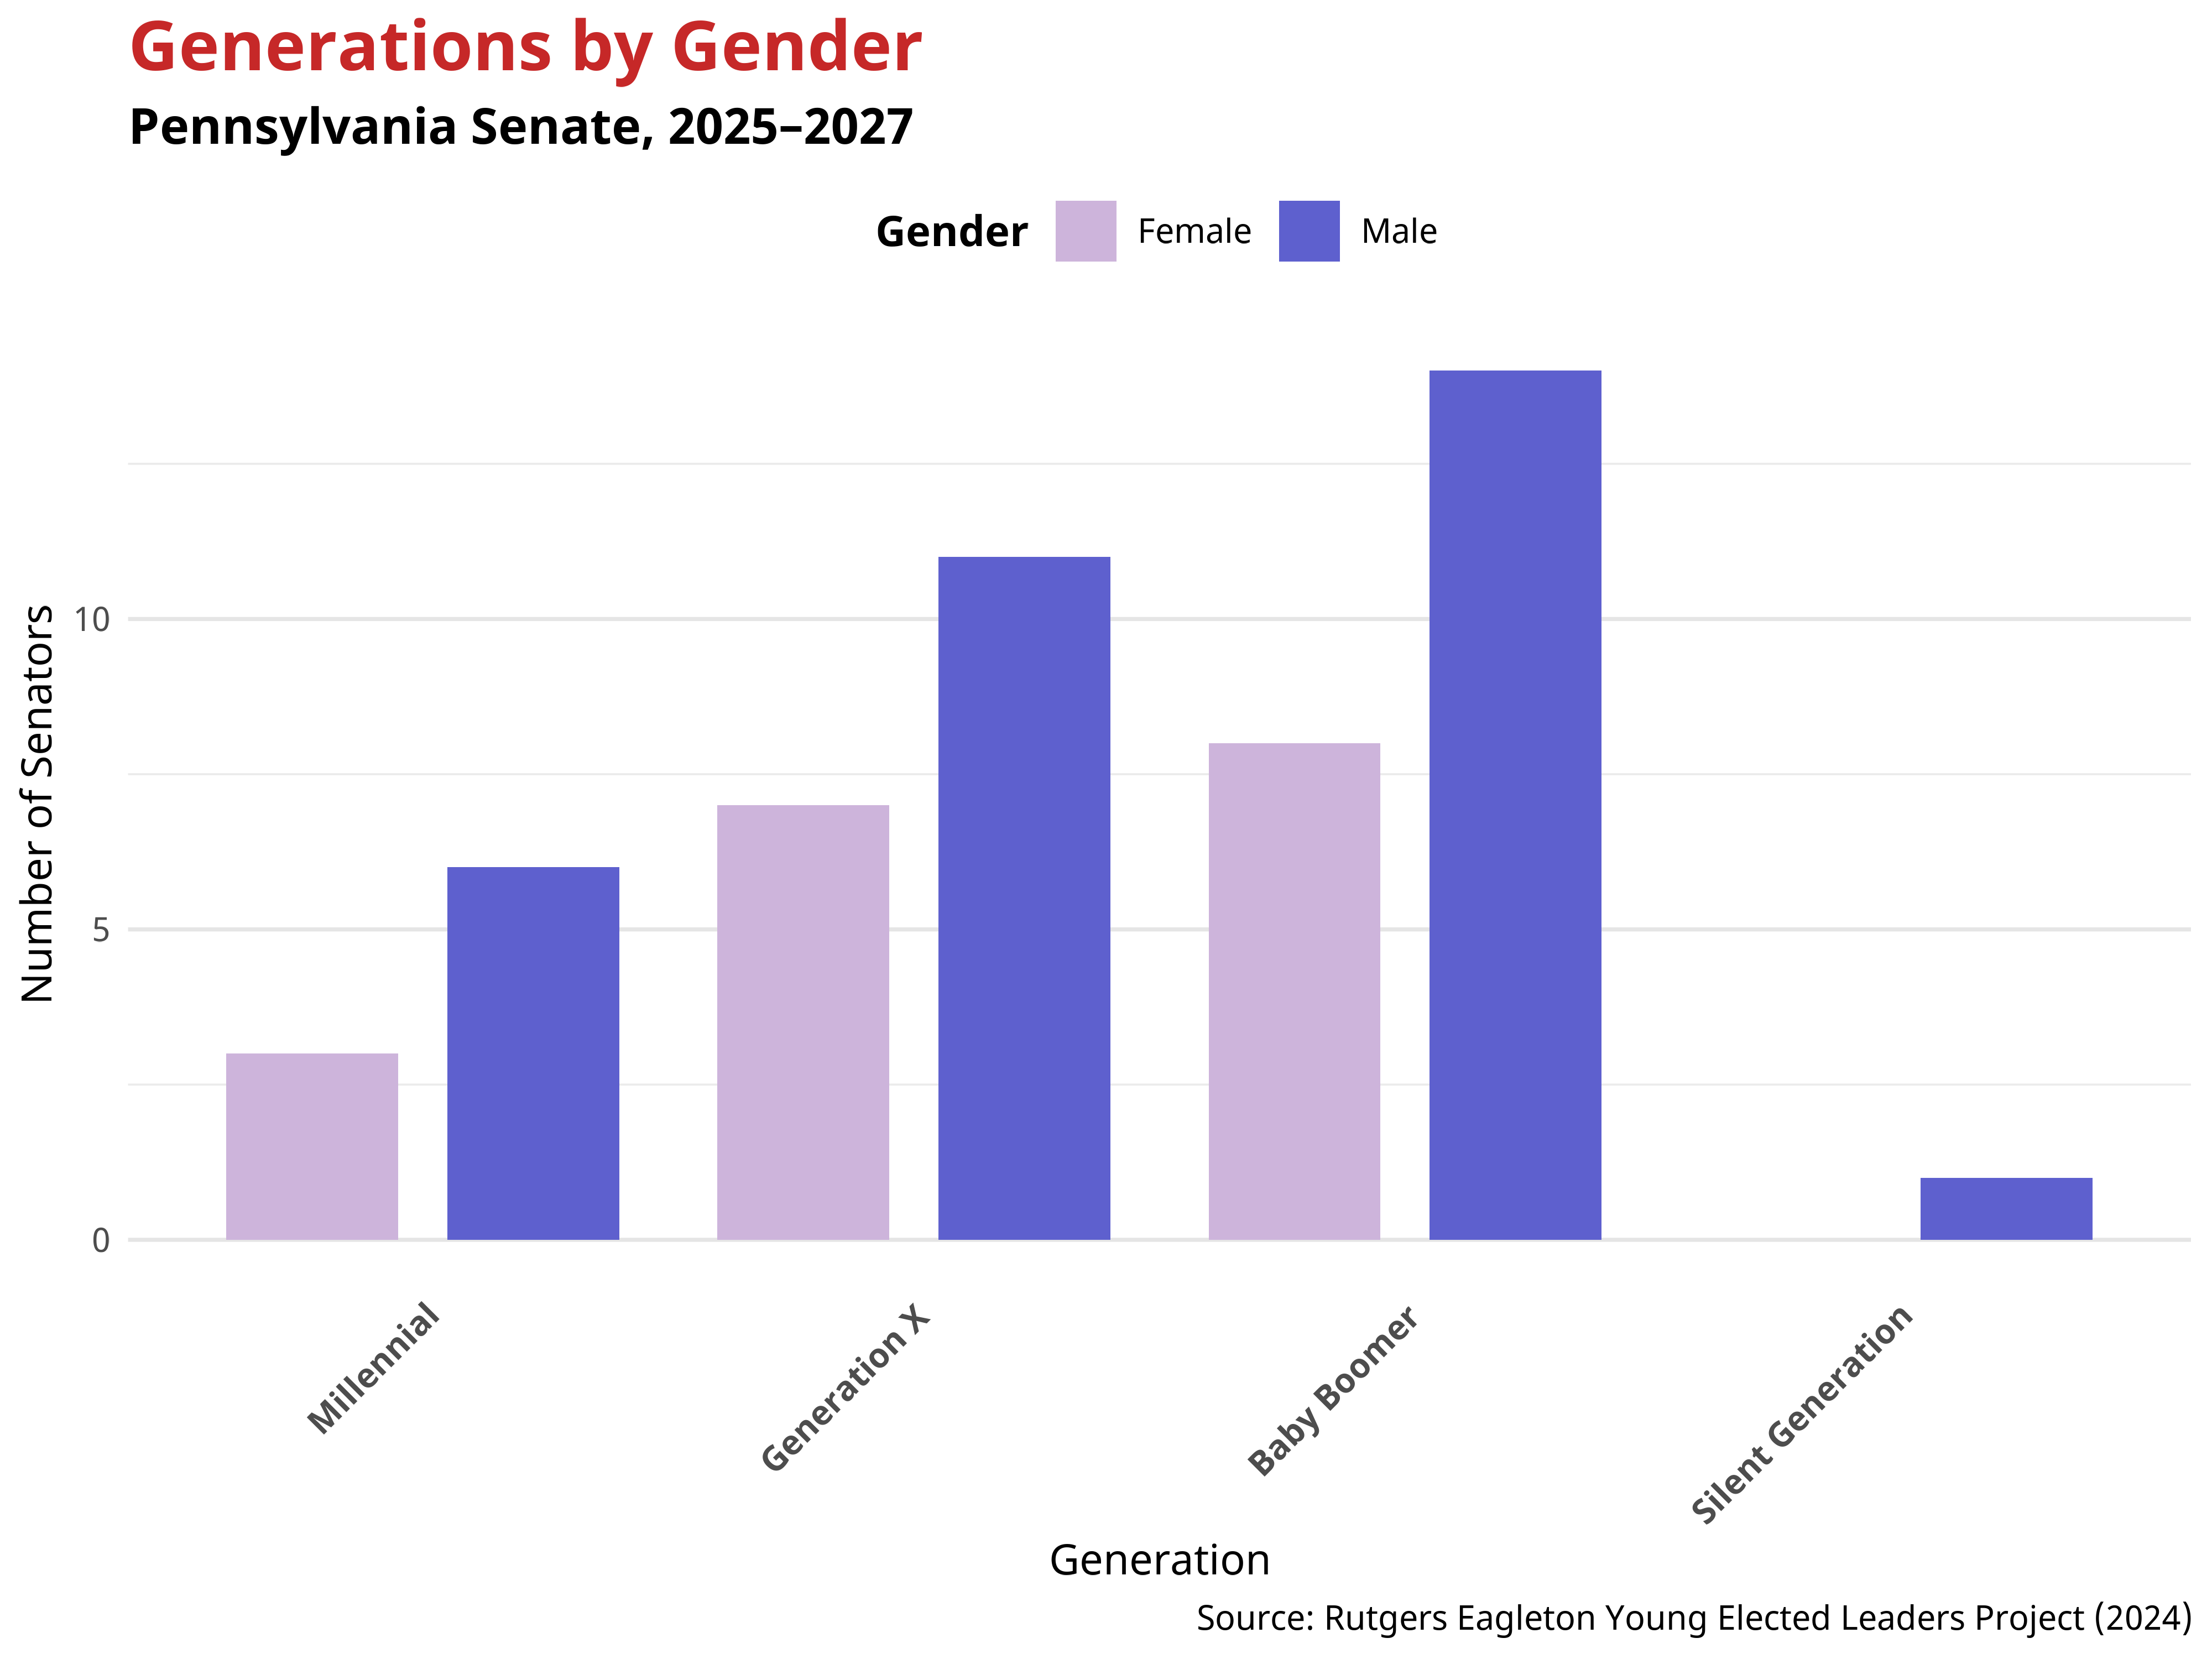
Gender in the Pennsylvania Senate
The generational makeup of the Pennsylvania Senate reveals notable gender dynamics. Overall, men are overrepresented across all age groups, especially among older generations. These patterns indicate that gender representation varies across generations, with women being represented in every generational cohort.
Race and Ethnicity in the Pennsylvania Senate
The racial and ethnic composition of the Pennsylvania Senate shows generational variation. The table below presents the distribution by generation.
Race and Ethnicity in the Pennsylvania Senate
| Ethnicity | Millennial Generation 1981–1996 |
Generation X 1965–1980 |
Boomer Generation 1946–1964 |
Silent Generation 1928–1945 |
Full Chamber |
|---|---|---|---|---|---|
| White / Caucasian | 8 (88.89%) | 16 (88.89%) | 19 (86.36%) | 1 (100%) | 44 (88%) |
| Black / African American | 0 (0%) | 1 (5.56%) | 3 (13.64%) | 0 (0%) | 4 (8%) |
| Asian / Pacific American | 1 (11.11%) | 0 (0%) | 0 (0%) | 0 (0%) | 1 (2%) |
| Asian / Pacific Islander | 0 (0%) | 1 (5.56%) | 0 (0%) | 0 (0%) | 1 (2%) |
| Total (Percent of Chamber) | 9 (18%) | 18 (36%) | 22 (44%) | 1 (2%) | 50 (100%) |
The full Pennsylvania State Senate comprises 50 seats.
Notes
The Young Elected Leaders Project applies the generational categorization of the Pew Research Center:
- Silent Generation: 1928 – 1945
- Baby Boomer Generation: 1946 – 1964
- Generation X: 1965 – 1980
- Millennial Generation: 1981 – 1996
- Generation Z: 1997 – 2012
This analysis is based on data from the most recent state legislative election in Pennsylvania which took place on November 5th 2024.
Citation Guideline
In referencing the Young Elected Leaders Project in publication please use the following language: “The Young Elected Leaders Project is housed at the Center for Youth Political Participation at The Eagleton Institute of Politics, Rutgers University – New Brunswick.”
Bibliographic Citation For this document
Author: Young Elected Leaders Project
Corresponding Authors: George D. Quinn
Year: 2024
Title: Age in the 2025 Pennsylvania General Assembly