Age in the 2025 South Carolina General Assembly

The State of South Carolina held its elections for a new South Carolina House of Representatives and South Carolina State Senate on November 4th, 2024. In January 2025, the currently active 2025 legislative session of the South Carolina House of Representatives began. Among the members elected, 8 were aged 35 or younger on the day of the 2024 election. Below is a map of these representatives within both chambers of the South Carolina General Assembly.
South Carolina Demographic Background in the 2024 Election
Preliminary estimates from CIRCLE at Tufts University indicate that 42% of young people aged 18–29 voted in the 2024 election, with turnout surpassing 50% in key battleground states. Nearly 50 million young citizens were eligible to vote nationwide, including over 8 million who turned 18 since the 2022 midterms.
According to the Pew Research Center, Millennials surpassed Baby Boomers in 2020 to become the largest generation in the U.S., making up 31% of the population, followed closely by Boomers at 30.9%. Generation X accounts for 28%, while the Silent Generation makes up just 9.9%.
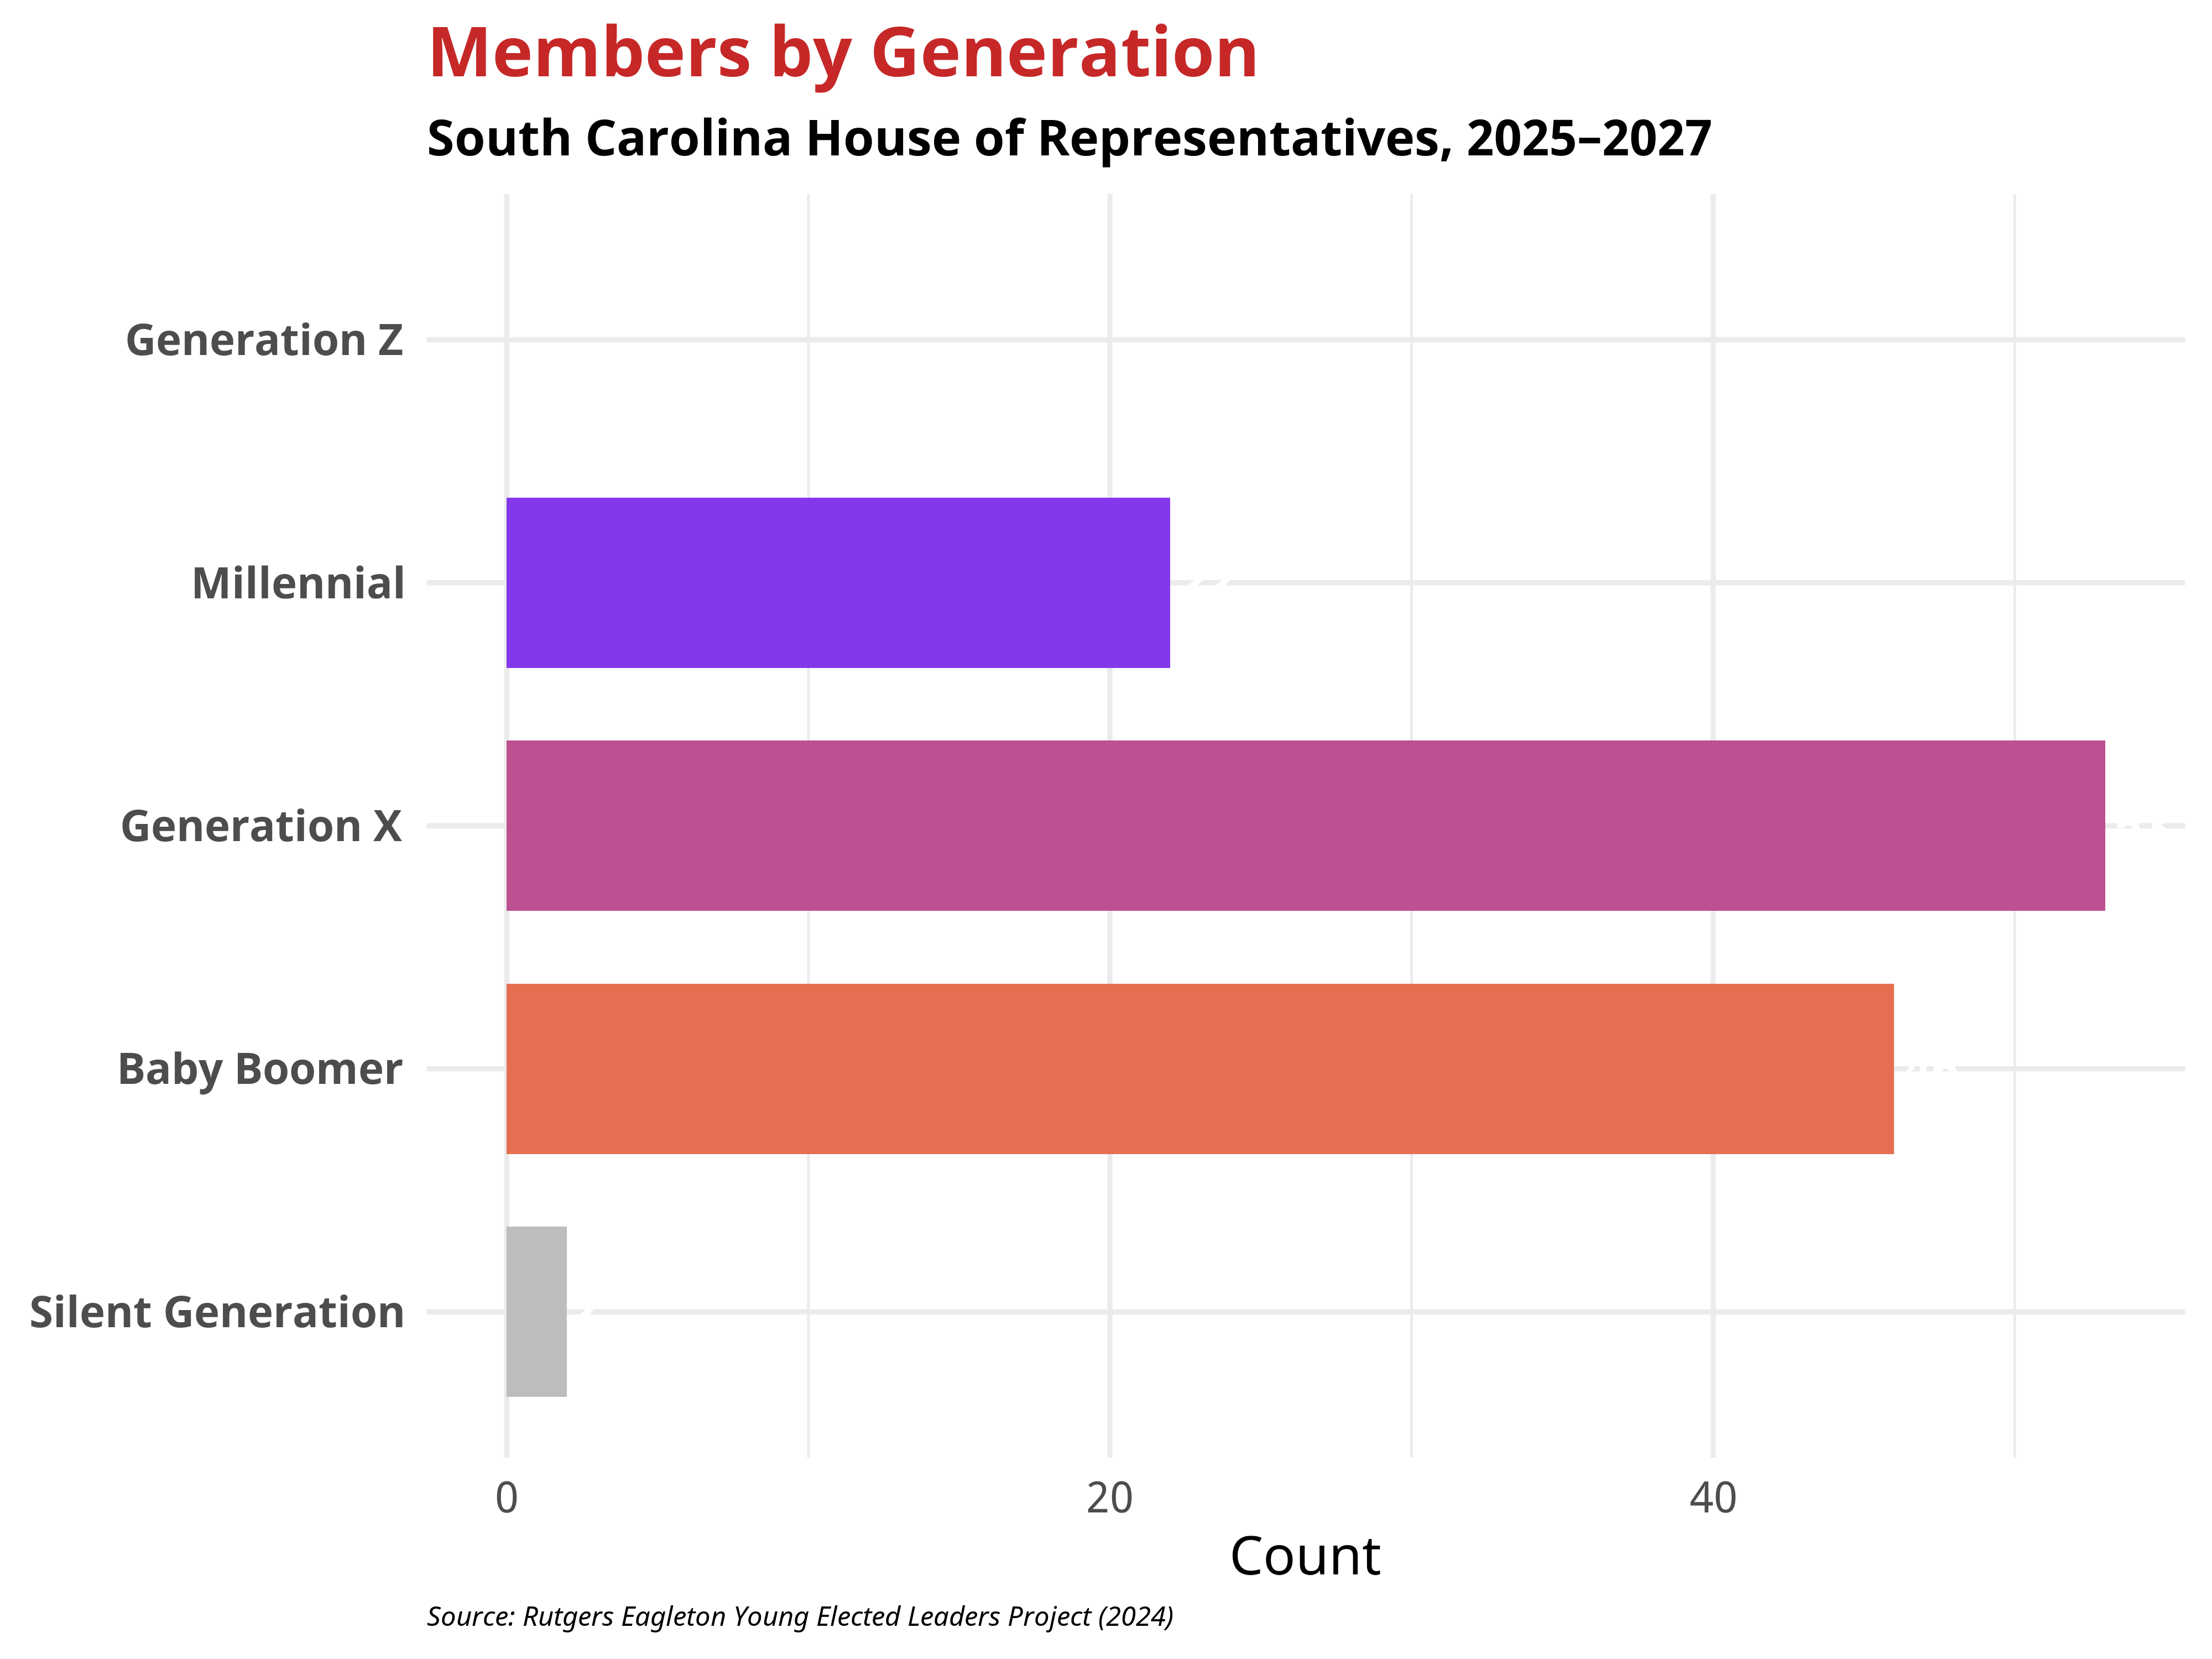
The South Carolina House of Representatives 2025 Legislative Session
Below is information covering age dynamics in the recently elected members of the South Carolina House of Representatives
- The average age among South Carolina House members was 55.48 years
- The youngest Representative, Brandon Michael Newton, was born in 1994
- The oldest Representative, William Clyburn, was born in 1941
- 6 Representatives are Young Elected Leaders age 35 or younger as of Election Day 2024
Generational Breakdown
Within the South Carolina House of Representatives, most representatives come from the Millennial, Generation X, or the Baby Boomer generations. Scroll below to view the generations represented in the South Carolina House of Representatives.
Partisanship in the South Carolina House of Representatives
The chart below provides a further breakdown of the current partisan composition of the 2025 South Carolina House of Representatives. Each dot represents a single member, colored by both party affiliation and whether the legislator qualifies as a Young Elected Leader (YEL)—defined as age 35 or younger at the time of the election. This format provides a visual snapshot of generational and partisan distribution within the chamber, highlighting how younger legislators are positioned across party lines.
Partisan differences in the South Carolina House extend beyond ideology to include notable generational contrasts. As shown in the visual below, Democratic members have an average age of 56.35, while Republicans have a younger average age of 55.14. These disparities may reflect broader patterns in political recruitment, generational turnover, and the types of candidates emerging in recent election cycles. 
Young Elected Representatives – South Carolina House of Representatives
Following the 2024 State Legislative Elections in South Carolina, 6 members aged 35 or under were elected to the South Carolina House of Representatives. Below are all six members, ordered from youngest to oldest, along with information about their local districts and party affiliations.
Young Elected Representatives — South Carolina House of Representatives (Age ≤ 35)
| Name | District | Birth Year (Age on Election Day 2024) | First Elected | |
|---|---|---|---|---|
 |
Brandon Newton (R) | District 45 —
Bluffton, SC |
1994 (Age 30) | 2012 |
 |
Steven Wayne Long (R) | District 37 —
Inman, SC |
1994 (Age 30) | 2016 |
 |
Kambrell H. Garvin (D) | District 77 —
Columbia, SC |
1991 (Age 33) | 2018 |
 |
Josiah Magnuson (R) | District 38 —
Campobello, SC |
1991 (Age 33) | 2016 |
 |
Jordan Scott Pace (R) | District 117 —
Goose Creek, SC |
1989 (Age 35) | 2022 |
 |
Hamilton R. Grant (D) | District 79 —
Columbia, SC |
1988 (Age 35) | 2024 |
Photos Courtesy of the South Carolina House member roster
Gender in the South Carolina House of Representatives
The South Carolina House of Representatives reflects a range of age and gender dynamics that help shape the composition of the state’s legislative body. In South Carolina, men make up a larger share of the chamber than women. Across all members, 83.06% are men, while women make up 16.13%. For female representatives, the average age at the time of the election was 54.45; for men, it was 55.68. Of the 6 Young Elected Leaders, all six are male.

When examining both gender and party affiliation, additional age differences emerge within the South Carolina House of Representatives. Republican men and women have a higher average age when compared to Democrats. These patterns show that age representation in the South Carolina House of Representatives varies by both gender and partisan alignment, highlighting differing pathways to political office across demographic groups.

Race and Ethnicity in the South Carolina House of Representatives
The racial and ethnic composition of the South Carolina House of Representatives varies across generations. In 2024, younger cohorts exhibit greater diversity, although the chamber as a whole remains predominantly White. The table below shows the distribution of each generation.
Race and Ethnicity in the South Carolina House of Representatives
| Ethnicity | Millennial Generation 1981–1996 |
Generation X 1965–1980 |
Boomer Generation 1946–1964 |
Silent Generation 1928–1945 |
Full Chamber |
|---|---|---|---|---|---|
| White / Caucasian | 16 (72.73%) | 46 (86.79%) | 34 (73.91%) | 1 (50%) | 97 (78.86%) |
| Black / African American | 5 (22.73%) | 7 (13.21%) | 12 (26.09%) | 1 (50%) | 25 (20.33%) |
| American Indian / Native American | 1 (4.55%) | 0 (0%) | 0 (0%) | 0 (0%) | 1 (0.81%) |
| Total (Percent of Chamber) | 22 (17.89%) | 53 (43.09%) | 46 (37.4%) | 2 (1.63%) | *123 (100%) |
The full South Carolina House of Representatives comprises 124 seats. *One seat was vacant following Election Day.
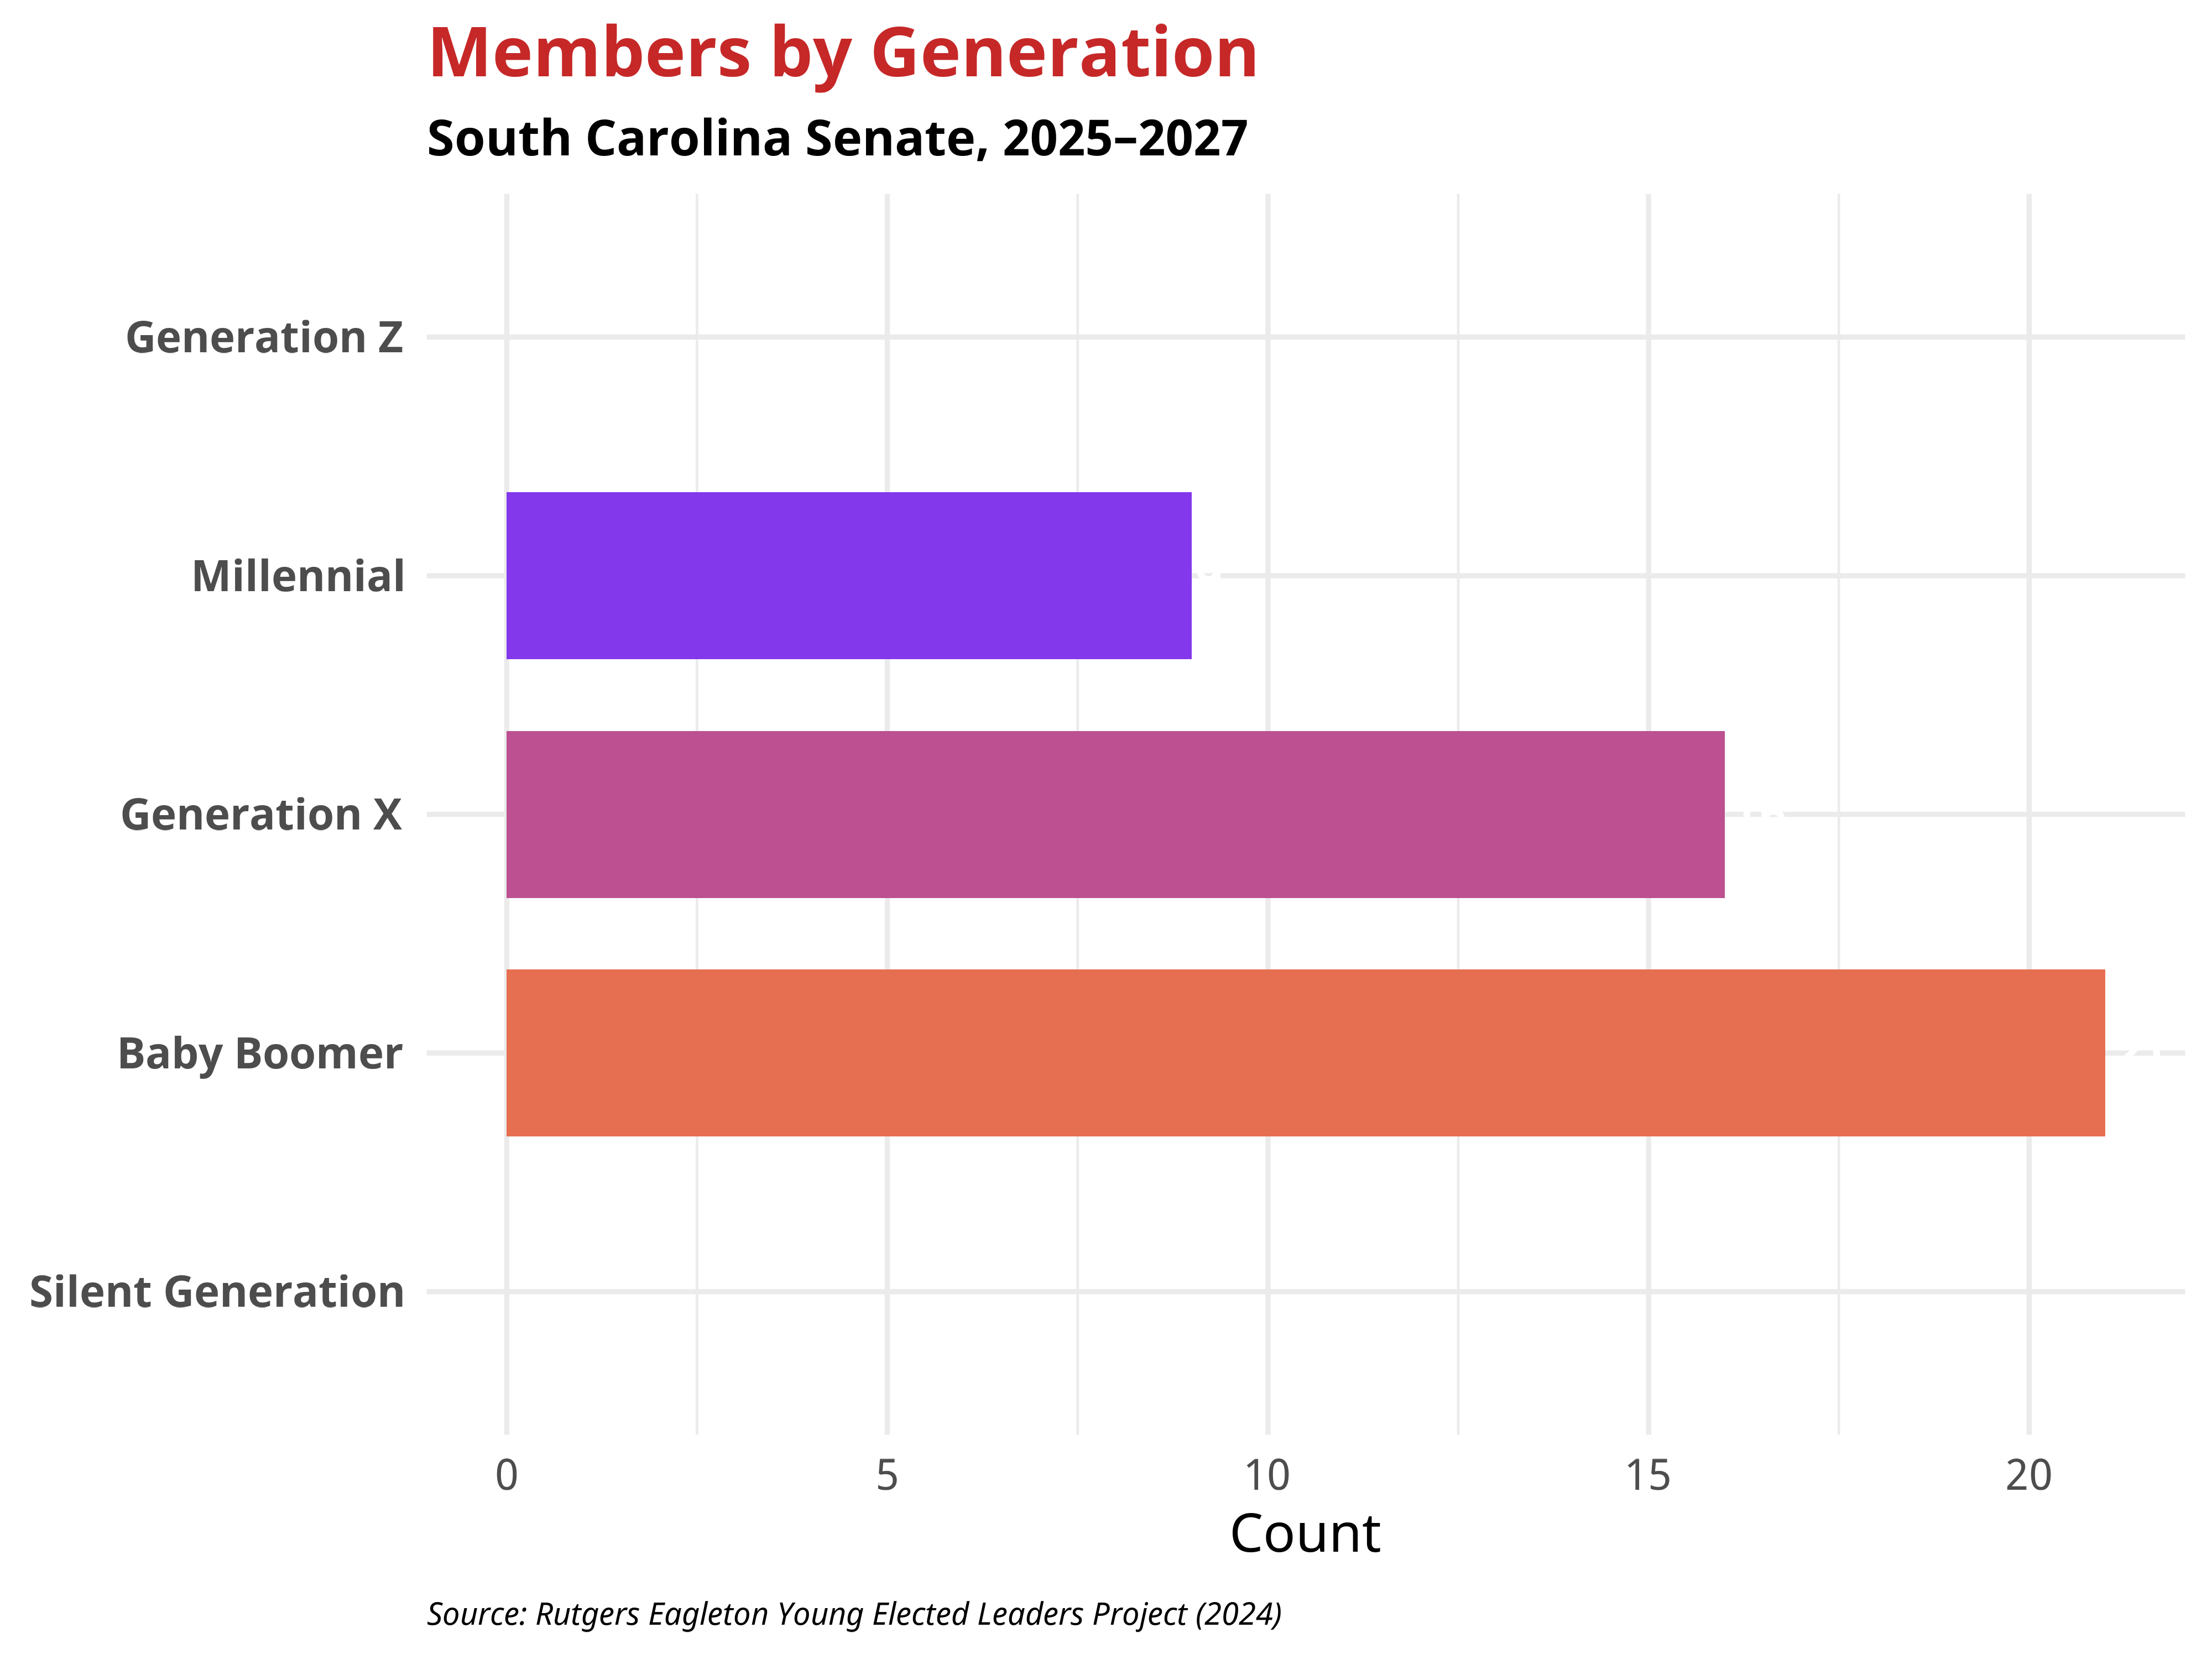
The South Carolina Senate
Below is information covering age dynamics in the recently elected South Carolina Senate
- The average age of South Carolina State Senate members is 55.82 years
- The youngest Senator is James D. Chaplin, born in 1994
- The oldest Senator is Harvey S. Peeler Jr., born in 1947
- 2 members of the South Carolina State Senate are Young Elected Leaders, aged 35 or younger as of Election Day 2024
Young Elected Senators in the South Carolina State Senate
Following the 2024 State Legislative Elections in South Carolina, six members aged 35 or under were elected to (and currently serve in) the South Carolina State Senate.
Young Elected Senators — South Carolina Senate (Age ≤ 35)
| Name | District | Birth Year (Age on Election Day 2024) | First Elected | |
|---|---|---|---|---|
 |
James D. Chaplin (R) | District 29 — Hartsville, SC | 1994 (Age 30) | 2024 |
 |
Deon T. Tedder (D) | District 42 — North Charleston, SC | 1990 (Age 34) | 2023 |
Photos courtesy of the South Carolina Senate Member Roster.
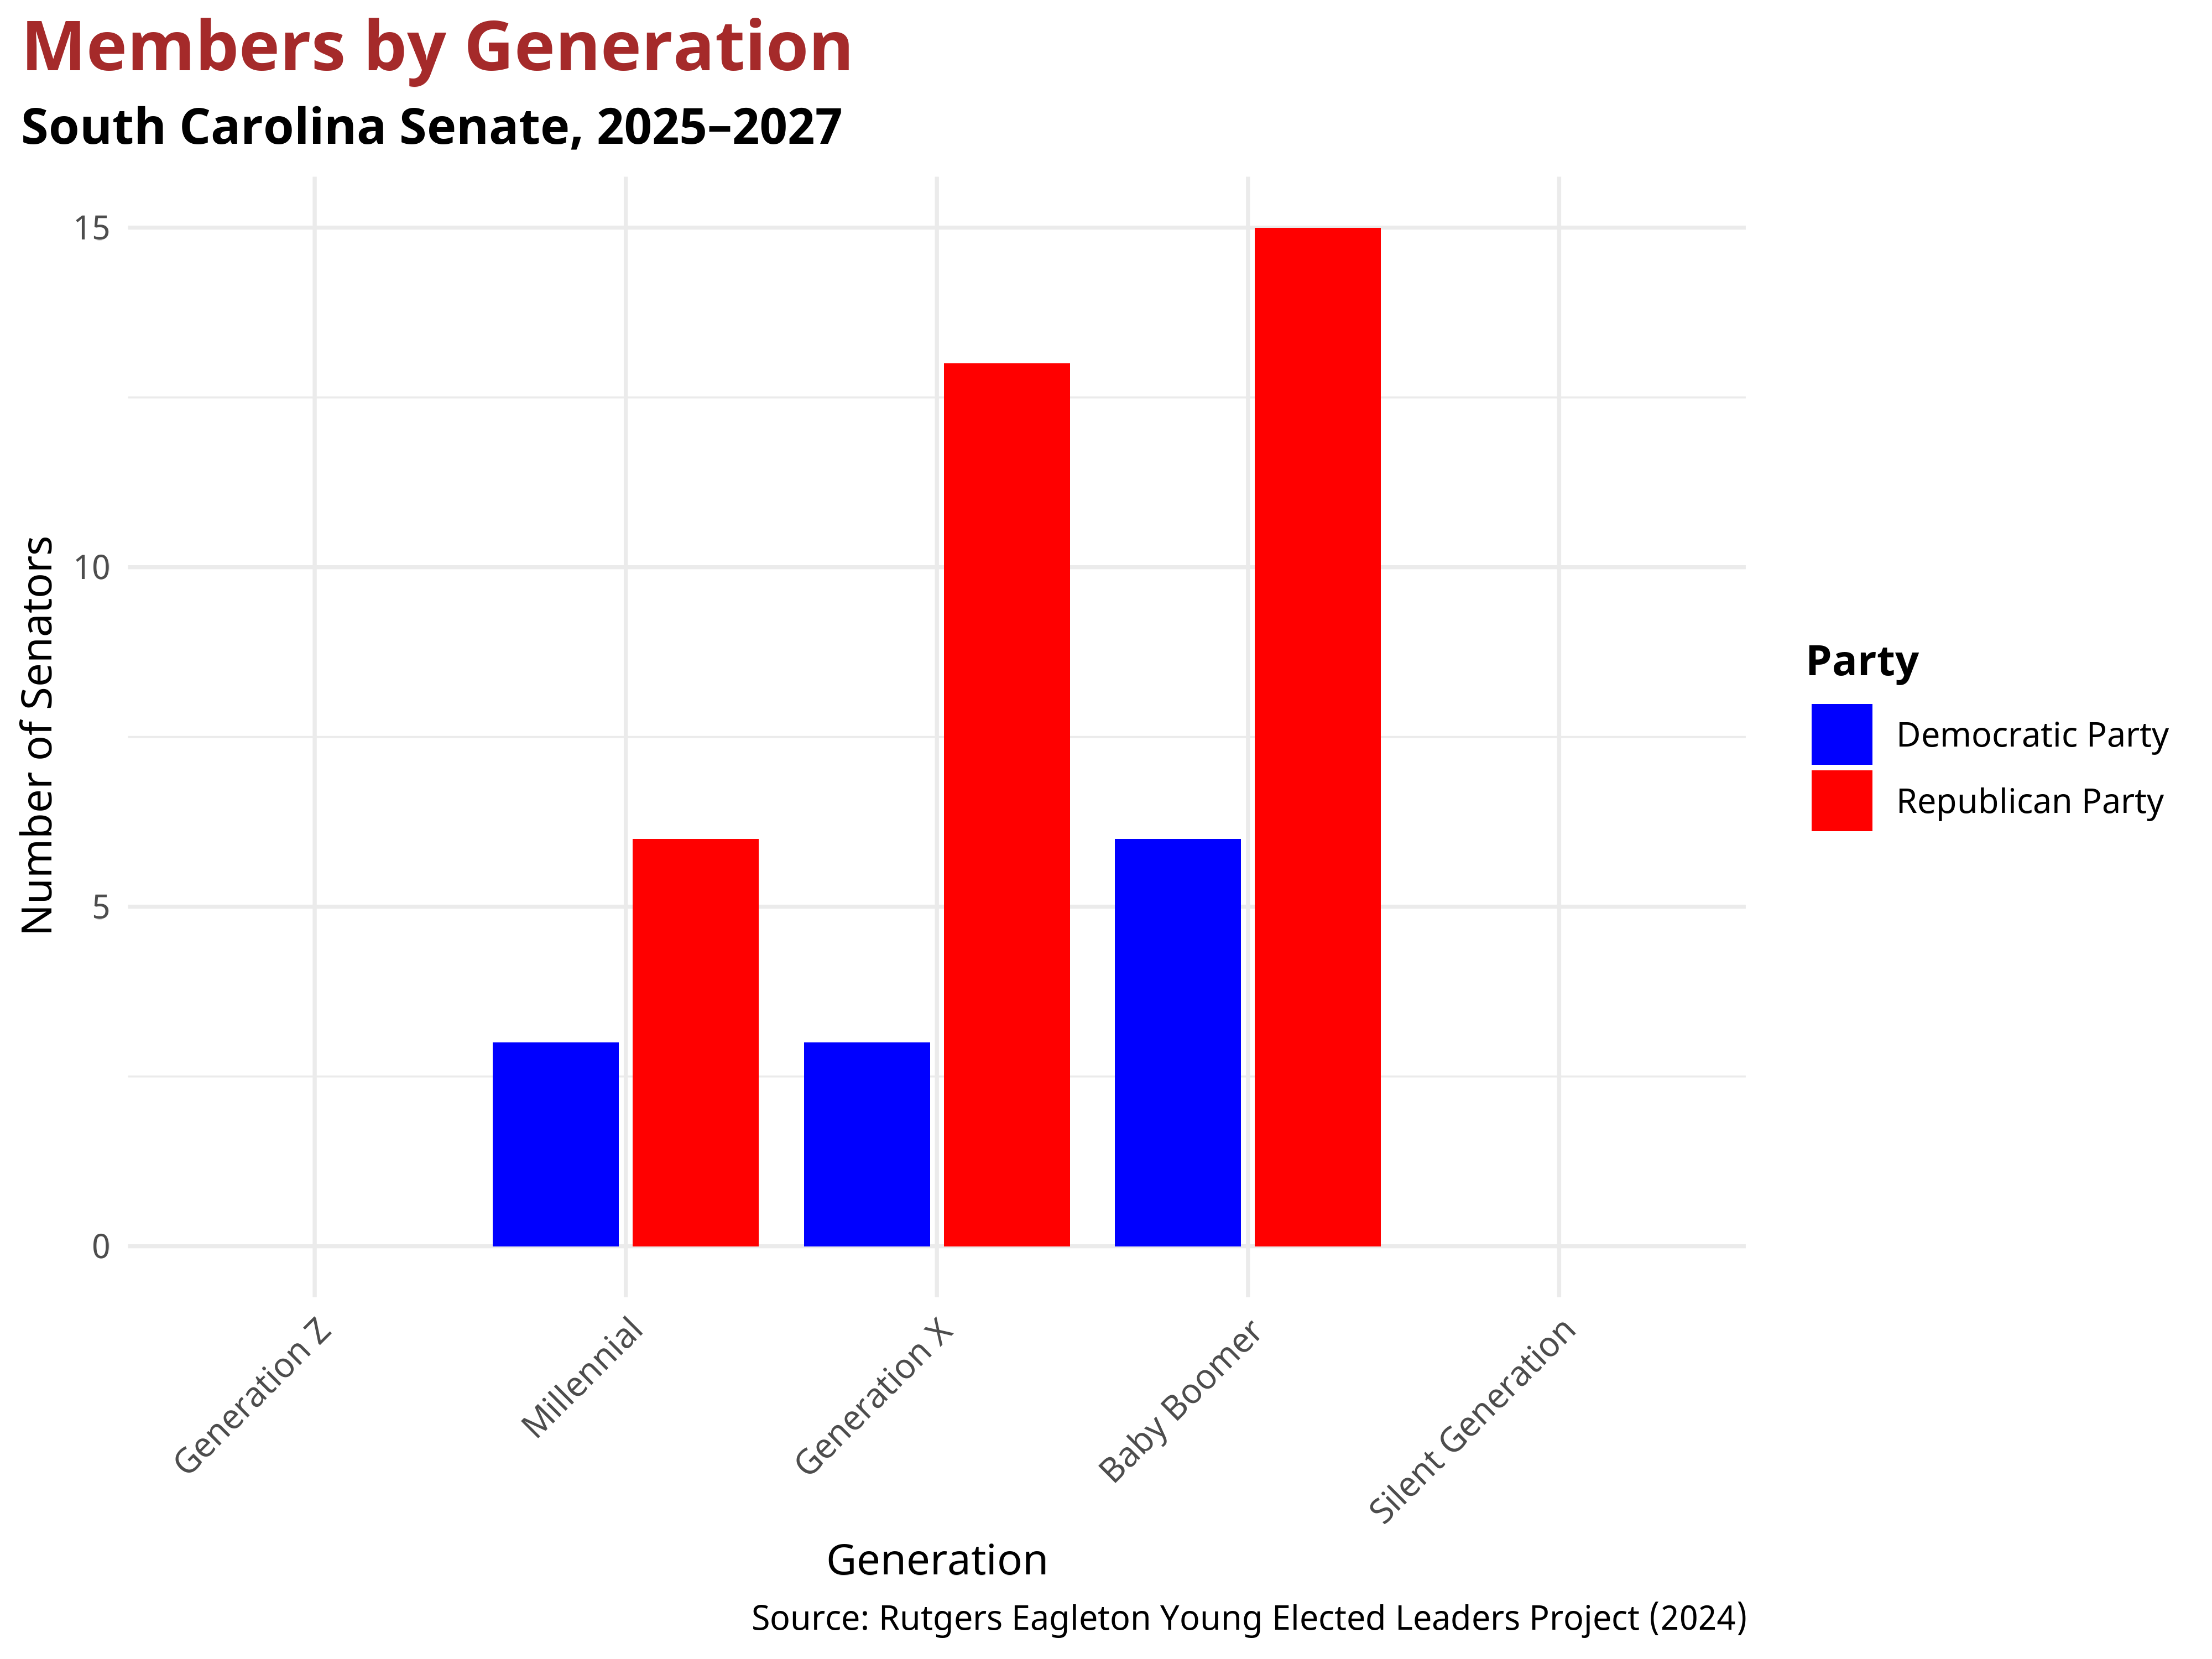
Partisanship in the South Carolina State Senate
In the South Carolina State Senate, 34 senators belong to the Republican Party, and 12 senators are Democrats. The mean age of Democratic state senators after the 2024 election was 54.3, while the mean age of Republican state senators was 56.36. Each generation has a different partisan makeup; overall, the South Carolina State Senate is overwhelmingly composed of Baby Boomers, Generation X, and Millennials. Below is the breakdown of party composition by generation in the South Carolina State Senate.
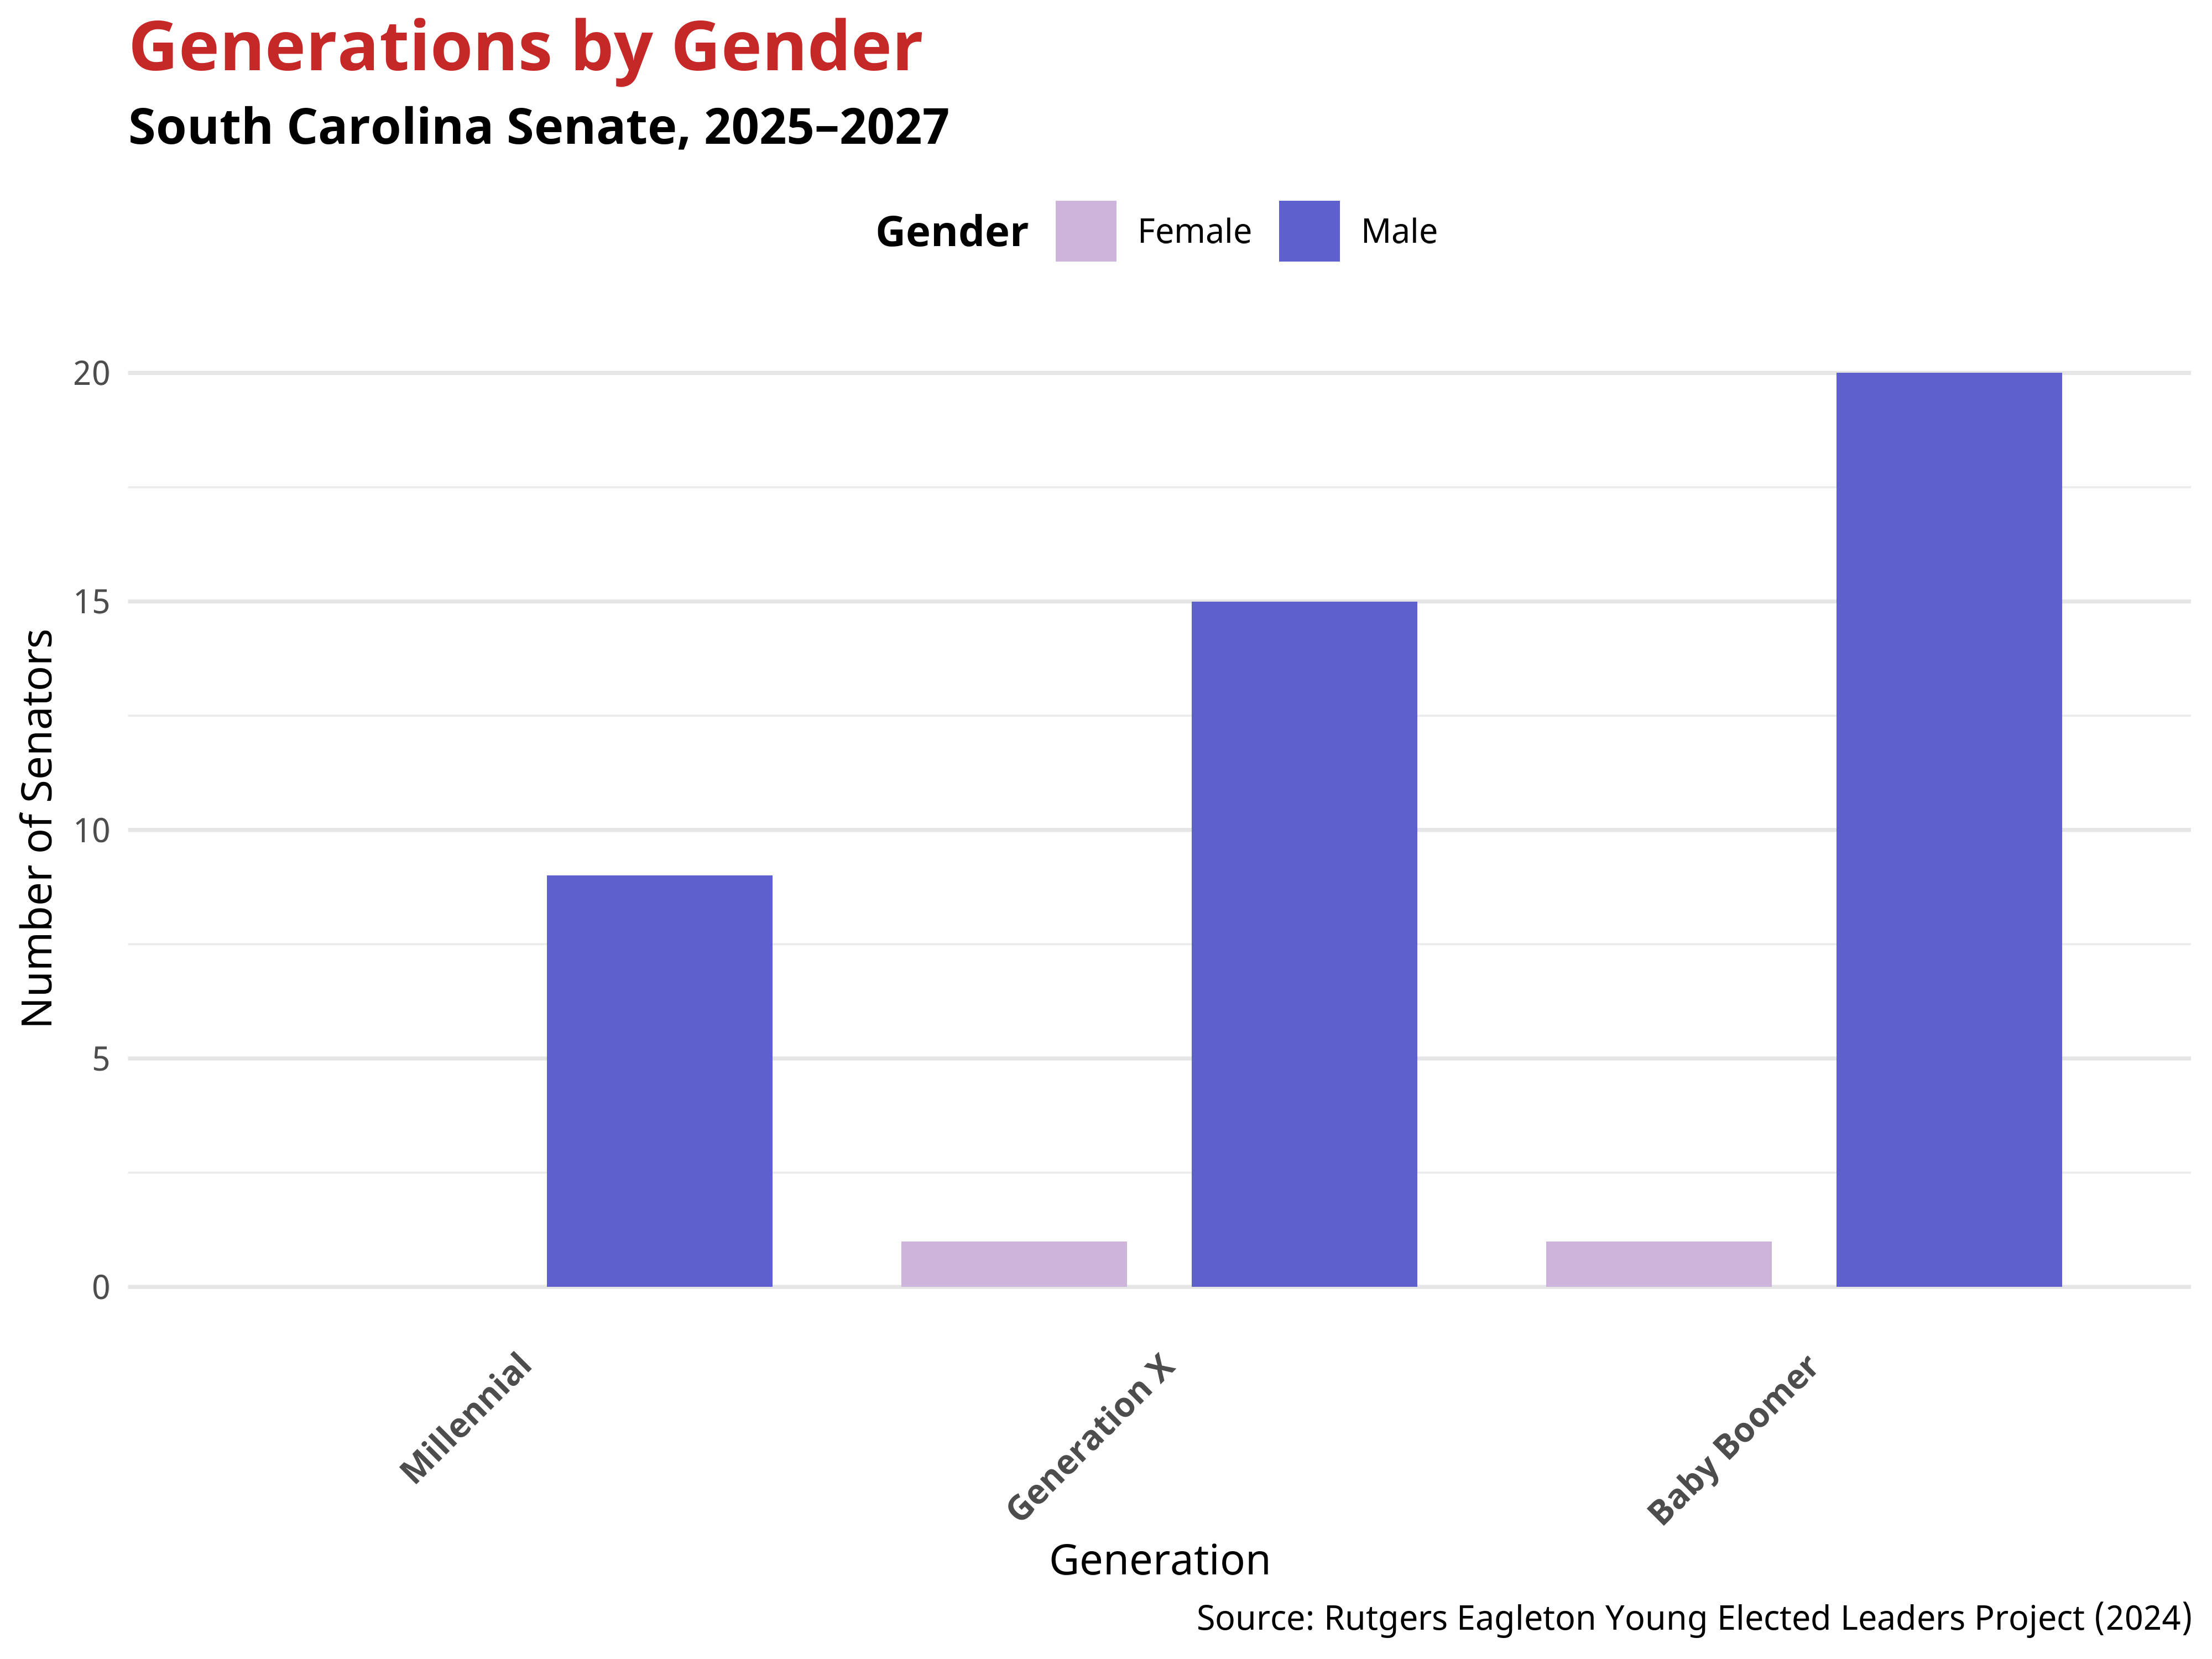
Gender in the South Carolina Senate
The generational makeup of the South Carolina Senate reveals notable gender dynamics. Overall, men are overrepresented across all age groups, especially among older generations. These patterns indicate that gender representation varies across generations, with women being represented in every generational cohort.
Race and Ethnicity in the South Carolina Senate
The racial and ethnic composition of the South Carolina Senate shows generational variation. The table below presents the distribution by generation.
Generations by Race/Ethnicity in the South Carolina Senate
| Ethnicity | Millennial Generation 1981–1996 |
Generation X 1965–1980 |
Boomer Generation 1946–1964 |
Full Chamber |
|---|---|---|---|---|
| White / Caucasian | 8 (88.89%) | 13 (81.25%) | 16 (76.19%) | 37 (80.43%) |
| Black / African American | 1 (11.11%) | 3 (18.75%) | 5 (23.81%) | 9 (19.57%) |
| Total (Percent of Chamber) | 9 (19.57%) | 16 (34.78%) | 21 (45.65%) | 46 (100%) |
The full South Carolina State Senate comprises 46 seats.
Notes
The Young Elected Leaders Project applies the generational categorization of the Pew Research Center:
- Silent Generation: 1928 – 1945
- Baby Boomer Generation: 1946 – 1964
- Generation X: 1965 – 1980
- Millennial Generation: 1981 – 1996
- Generation Z: 1997 – 2012
This analysis is based on data from the most recent state legislative election in South Carolina which took place on November 5th 2024.
Citation Guideline
In referencing the Young Elected Leaders Project in publication please use the following language: “The Young Elected Leaders Project is housed at the Center for Youth Political Participation at The Eagleton Institute of Politics, Rutgers University – New Brunswick.”
Bibliographic Citation For this document
Author: Young Elected Leaders Project
Corresponding Authors: George D. Quinn
Year: 2024
Title: Age in the 2025 South Carolina General Assembly