Age in the 2026 Virginia General Assembly

Photo courtesy of the Virginia General Assembly.
The Commonwealth of Virginia held its legislative elections, including special elections, on November 4, 2025, shaping the composition of the Virginia House of Delegates and Virginia State Senate for the upcoming legislative session. When the newly elected General Assembly convenes in January 2026, it will reflect the decisions made by voters across the Commonwealth’s legislative districts. Among those elected, eleven legislators qualify as Young Elected Leaders—defined as being 35 years old or younger on Election Day. In a state with a long history of political leadership and one of the oldest continuous lawmaking bodies in the Western Hemisphere, the presence of eleven young lawmakers signals a notable level of youth representation within Virginia’s state government. The map below highlights the districts represented by these young elected officials across the Commonwealth.
Virginia Demographic Background in the 2025 Election
Preliminary estimates from CIRCLE at Tufts University indicate that 42% of young people aged 18–29 voted in the 2024 election, with turnout surpassing 50% in key battleground states. Nearly 50 million young citizens were eligible to vote nationwide, including over 8 million who turned 18 since the 2022 midterms.
According to the Pew Research Center, Millennials surpassed Baby Boomers in 2020 to become the largest generation in the U.S., making up 31% of the population, followed closely by Boomers at 30.9%. Generation X accounts for 28%, while the Silent Generation makes up just 9.9%.
The Virginia House of Delegates 2026 Legislative Session
Below is information covering age dynamics in the recently elected members of the Virginia House of Delegates
- The average age among Virginia House members was 51.58 years
- The youngest Representative, Nadarius E. Clark, was born in 1995
- The oldest Representative, Vivian Edna Watts, was born in 1940
- 10 Representatives are Young Elected Leaders, age 35 or younger as of Election Day 2025
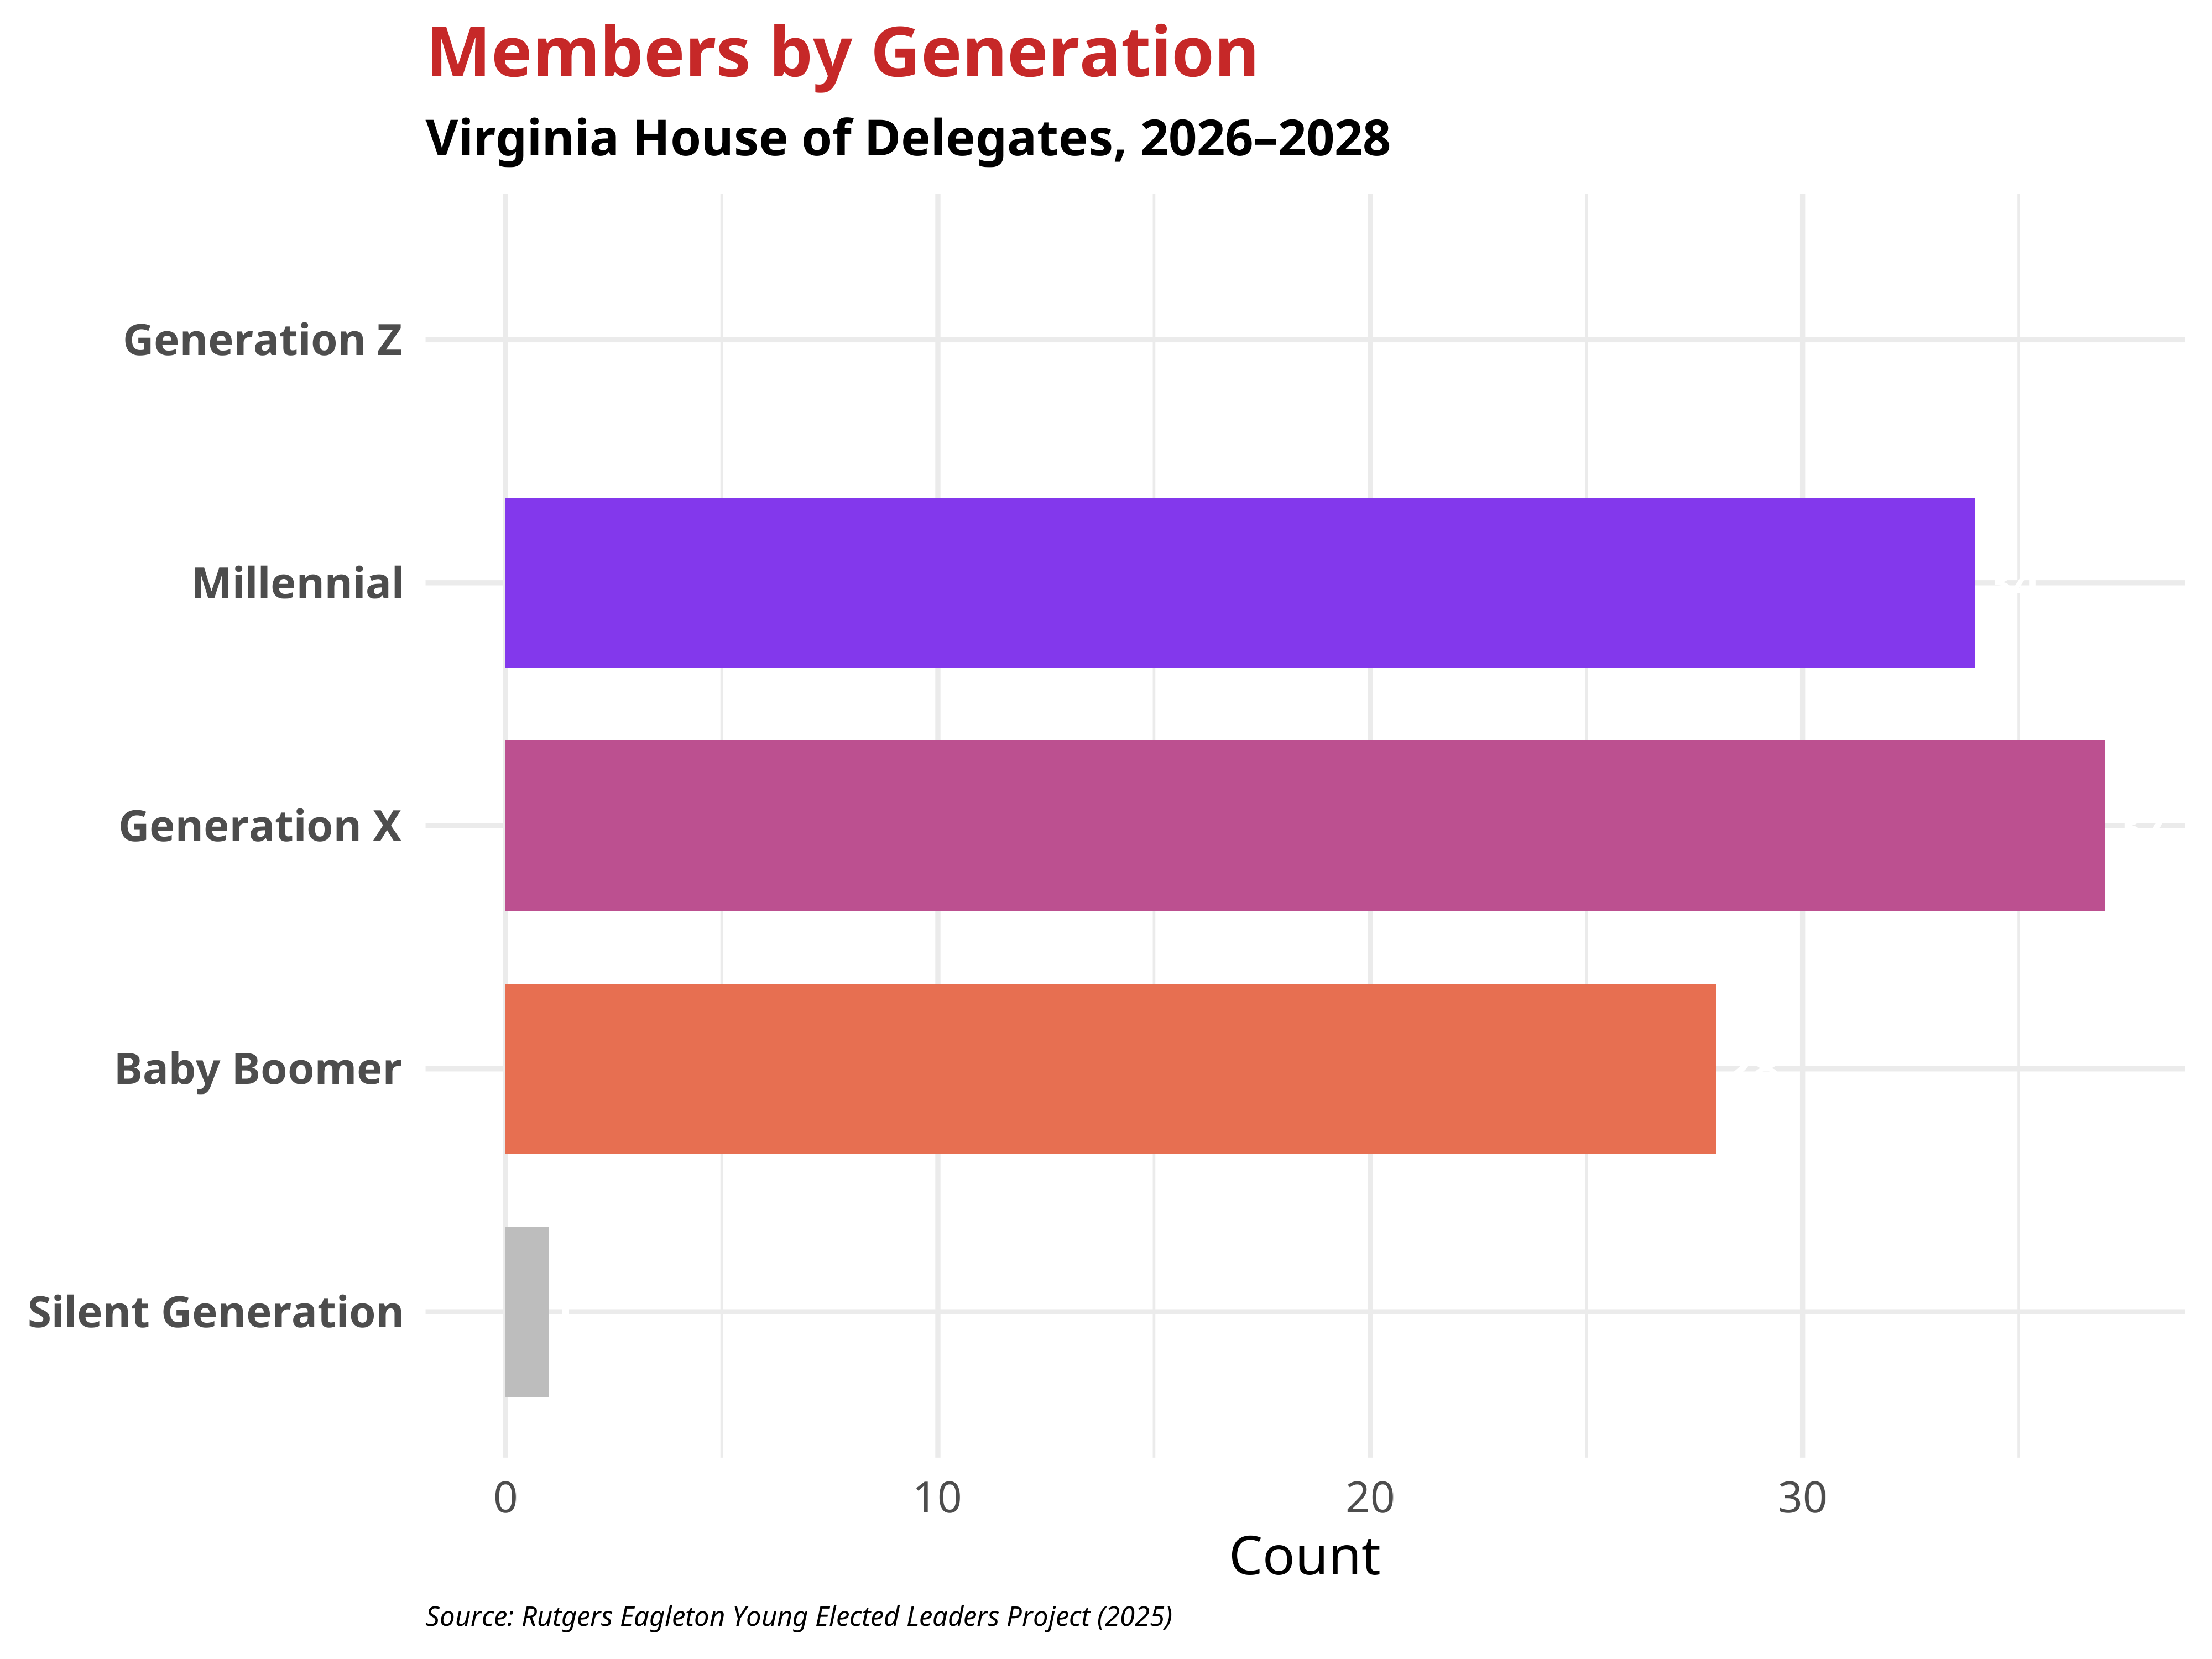
Generational Breakdown
Within the Virginia House of Delegates, most representatives come from the Millennial, Generation X, or the Baby Boomer generations. Scroll below to view the generations represented in the Virginia House of Delegates.
Partisanship in the Virginia House of Delegates
The chart below provides a further breakdown of the current partisan composition of the 2026 Virginia House of Delegates. Each dot represents a single member, colored by both party affiliation and whether the legislator qualifies as a Young Elected Leader (YEL)—defined as age 35 or younger at the time of the election. This format provides a visual snapshot of generational and partisan distribution within the chamber, highlighting how younger legislators are positioned across party lines.
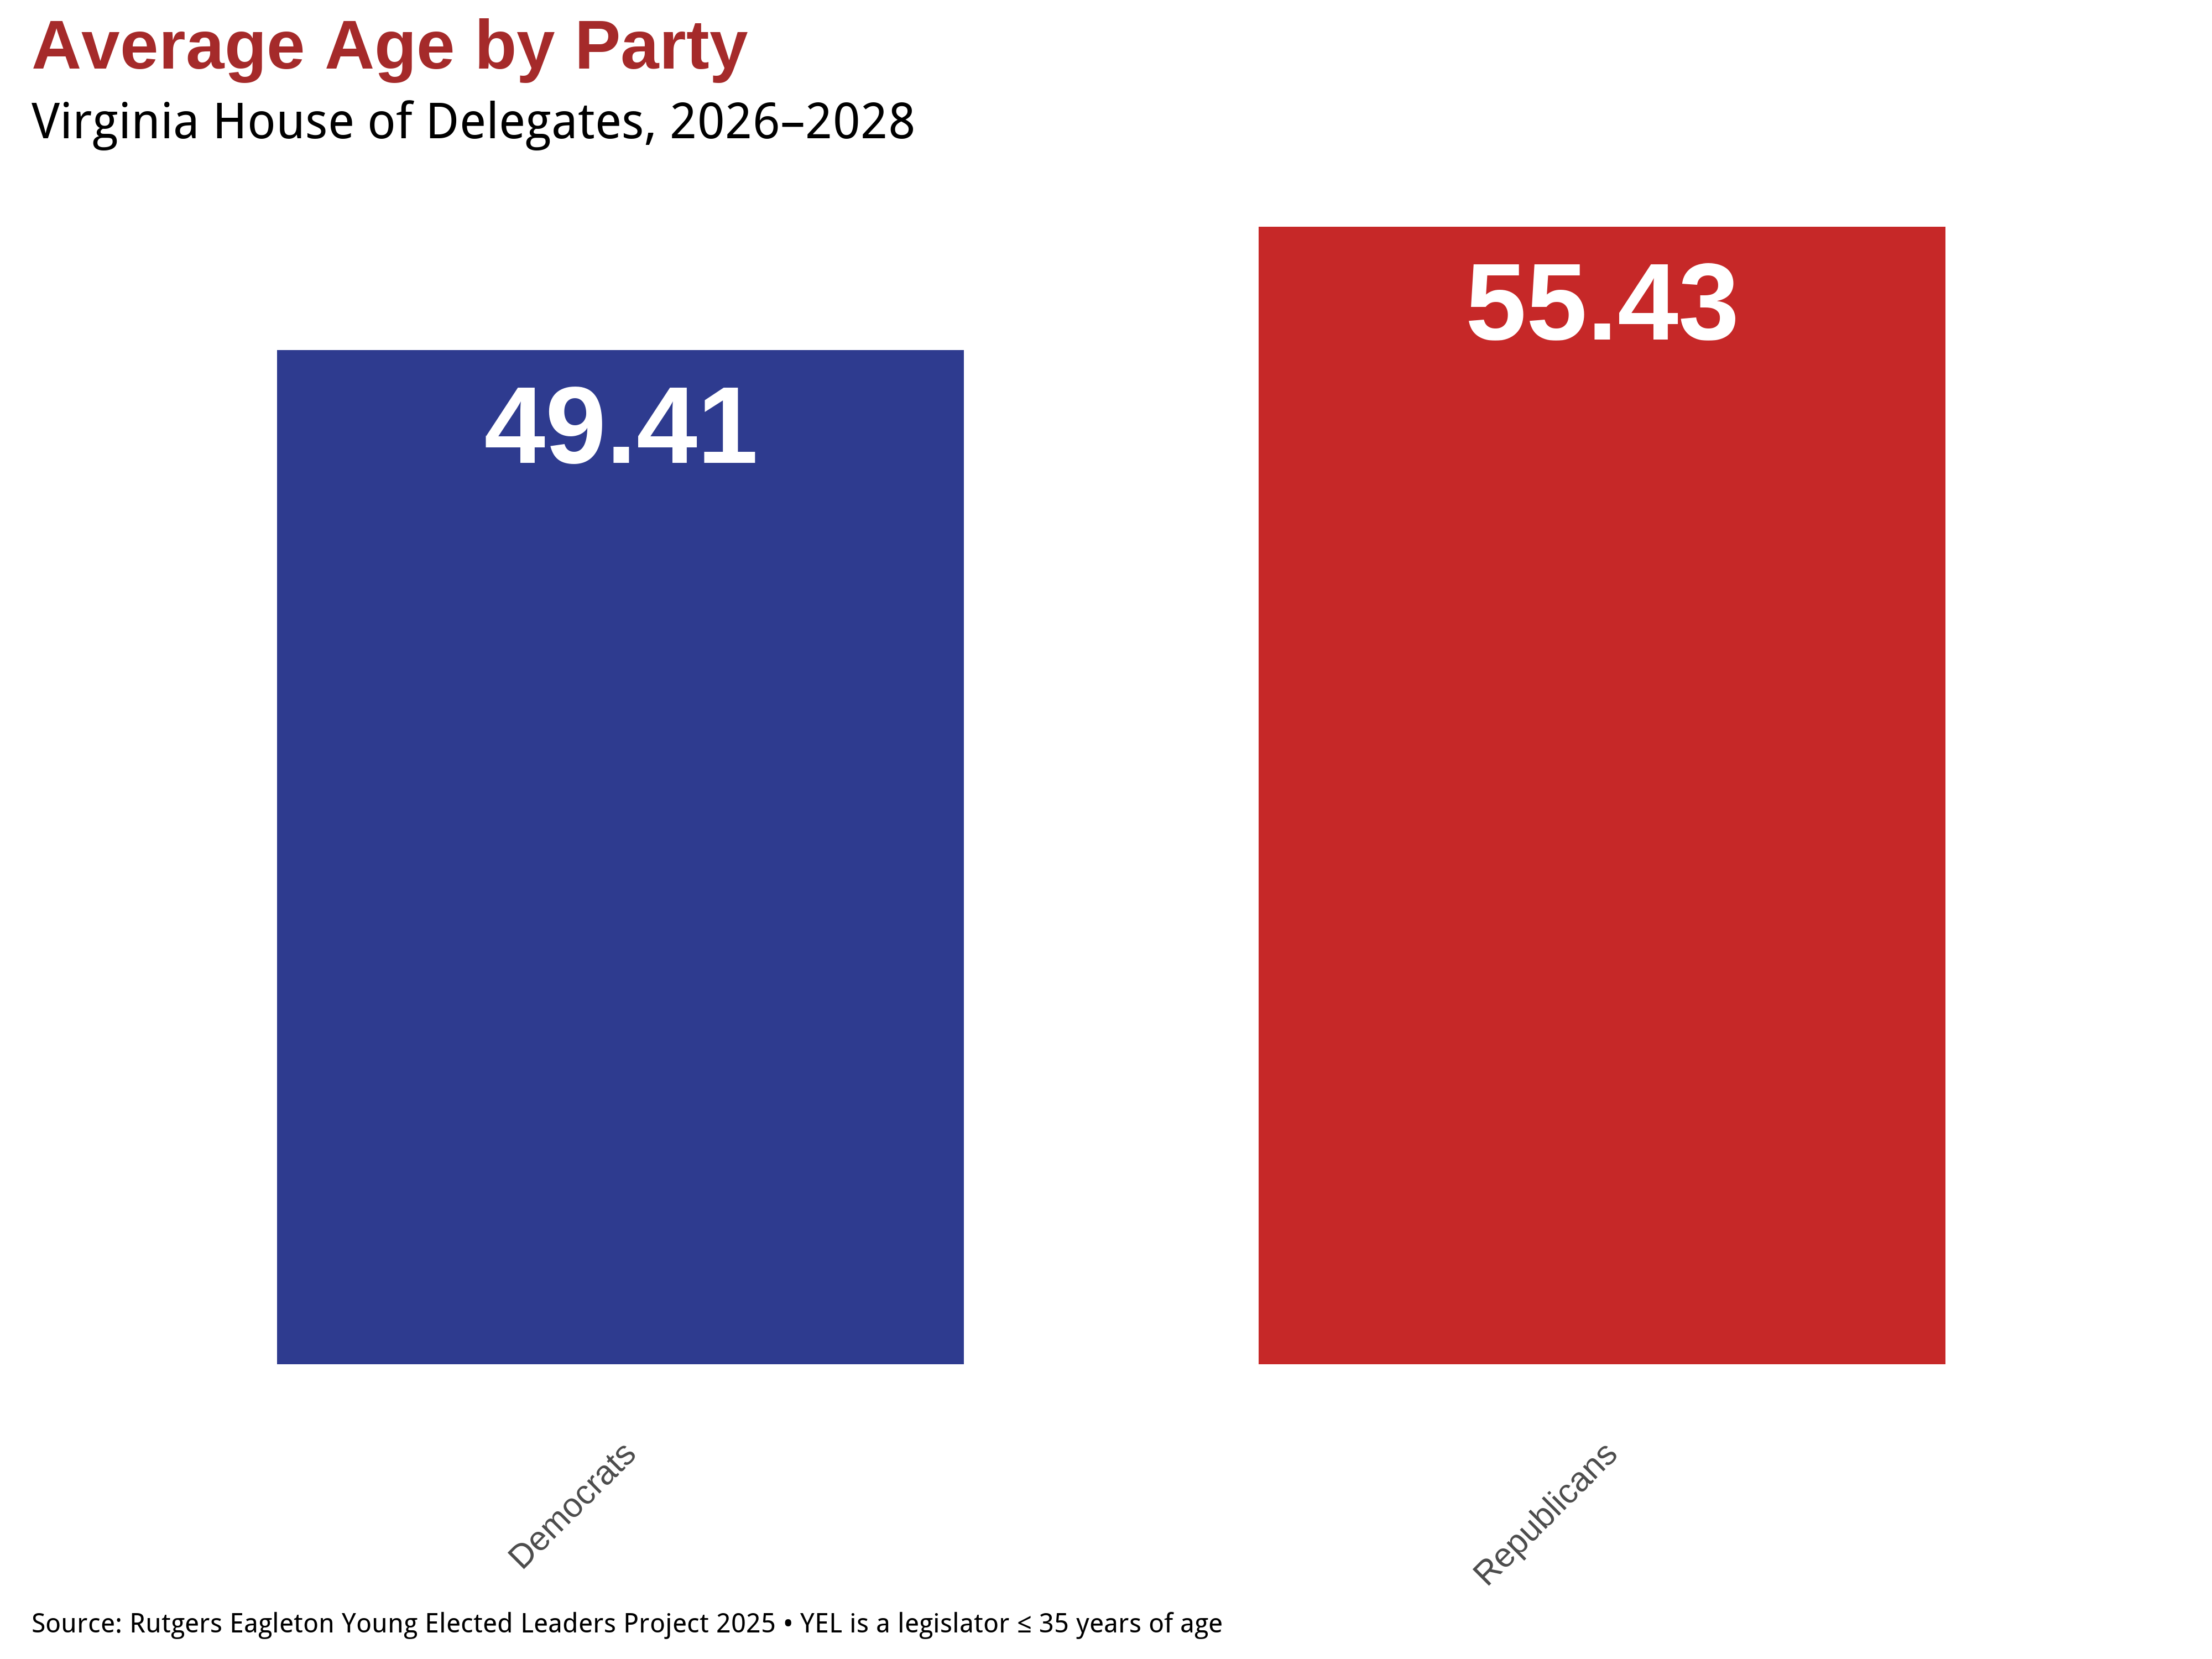
Partisan differences in the Virginia House of Delegates extend beyond ideology to include clear generational contrasts. As illustrated in the visual below, Democratic members have an average age of 49.41, while Republican members have a higher average age of 55.43. This roughly six-year gap highlights meaningful differences in generational representation between the parties and may reflect broader trends in candidate recruitment, leadership pipelines, and generational turnover within Virginia politics.
Young Elected Representatives – Virginia House of Delegates
Following the 2024 State Legislative Elections in Virginia, 10 members aged 35 or under were elected to the Virginia House of Delegates. Below are all 10 members, ordered from youngest to oldest, along with information about their local districts and party affiliations.
Young Elected Representatives — Virginia House of Delegates (Age ≤ 35)
| Name | District | Birth Year (Age on Election Day 2024) | First Elected | |
|---|---|---|---|---|
 |
Nadarius E. Clark (D) | District 84 — Hampton Roads, VA | 1995 (Age 30) | 2023 |
 |
Lillian V. Franklin (D) | District 41 — Montgomery County, VA | 1994 (Age 31) | 2025 |
 |
Mitchell D. Cornett (R) | District 46 — Grayson County, VA | 1994 (Age 31) | 2025 |
 |
Destiny L. LeVere Bolling (D) | District 80 — Henrico County, VA | 1994 (Age 31) | 2023 |
 |
Rozia A. Henson Jr. (D) | District 19 — Prince William, VA | 1993 (Age 32) | 2023 |
 |
John Chilton McAuliffe (D) | District 30 — Fauquier County, VA | 1992 (Age 33) | 2025 |
 |
Adele Y. McClure (D) | District 2 — Arlington, VA | 1990 (Age 35) | 2023 |
 |
Joshua G. Cole (D) | District 65 — Fredericksburg, VA | 1990 (Age 35) | 2023 |
 |
Briana D. Sewell (D) | District 25 — Woodbridge, VA | 1990 (Age 35) | 2021 |
 |
Wren M. Williams (R) | District 47 — Stuart, VA | 1989 (Age 35) | 2021 |
Photos Courtesy of the Virginia House member roster
Gender in the Virginia House of Delegates
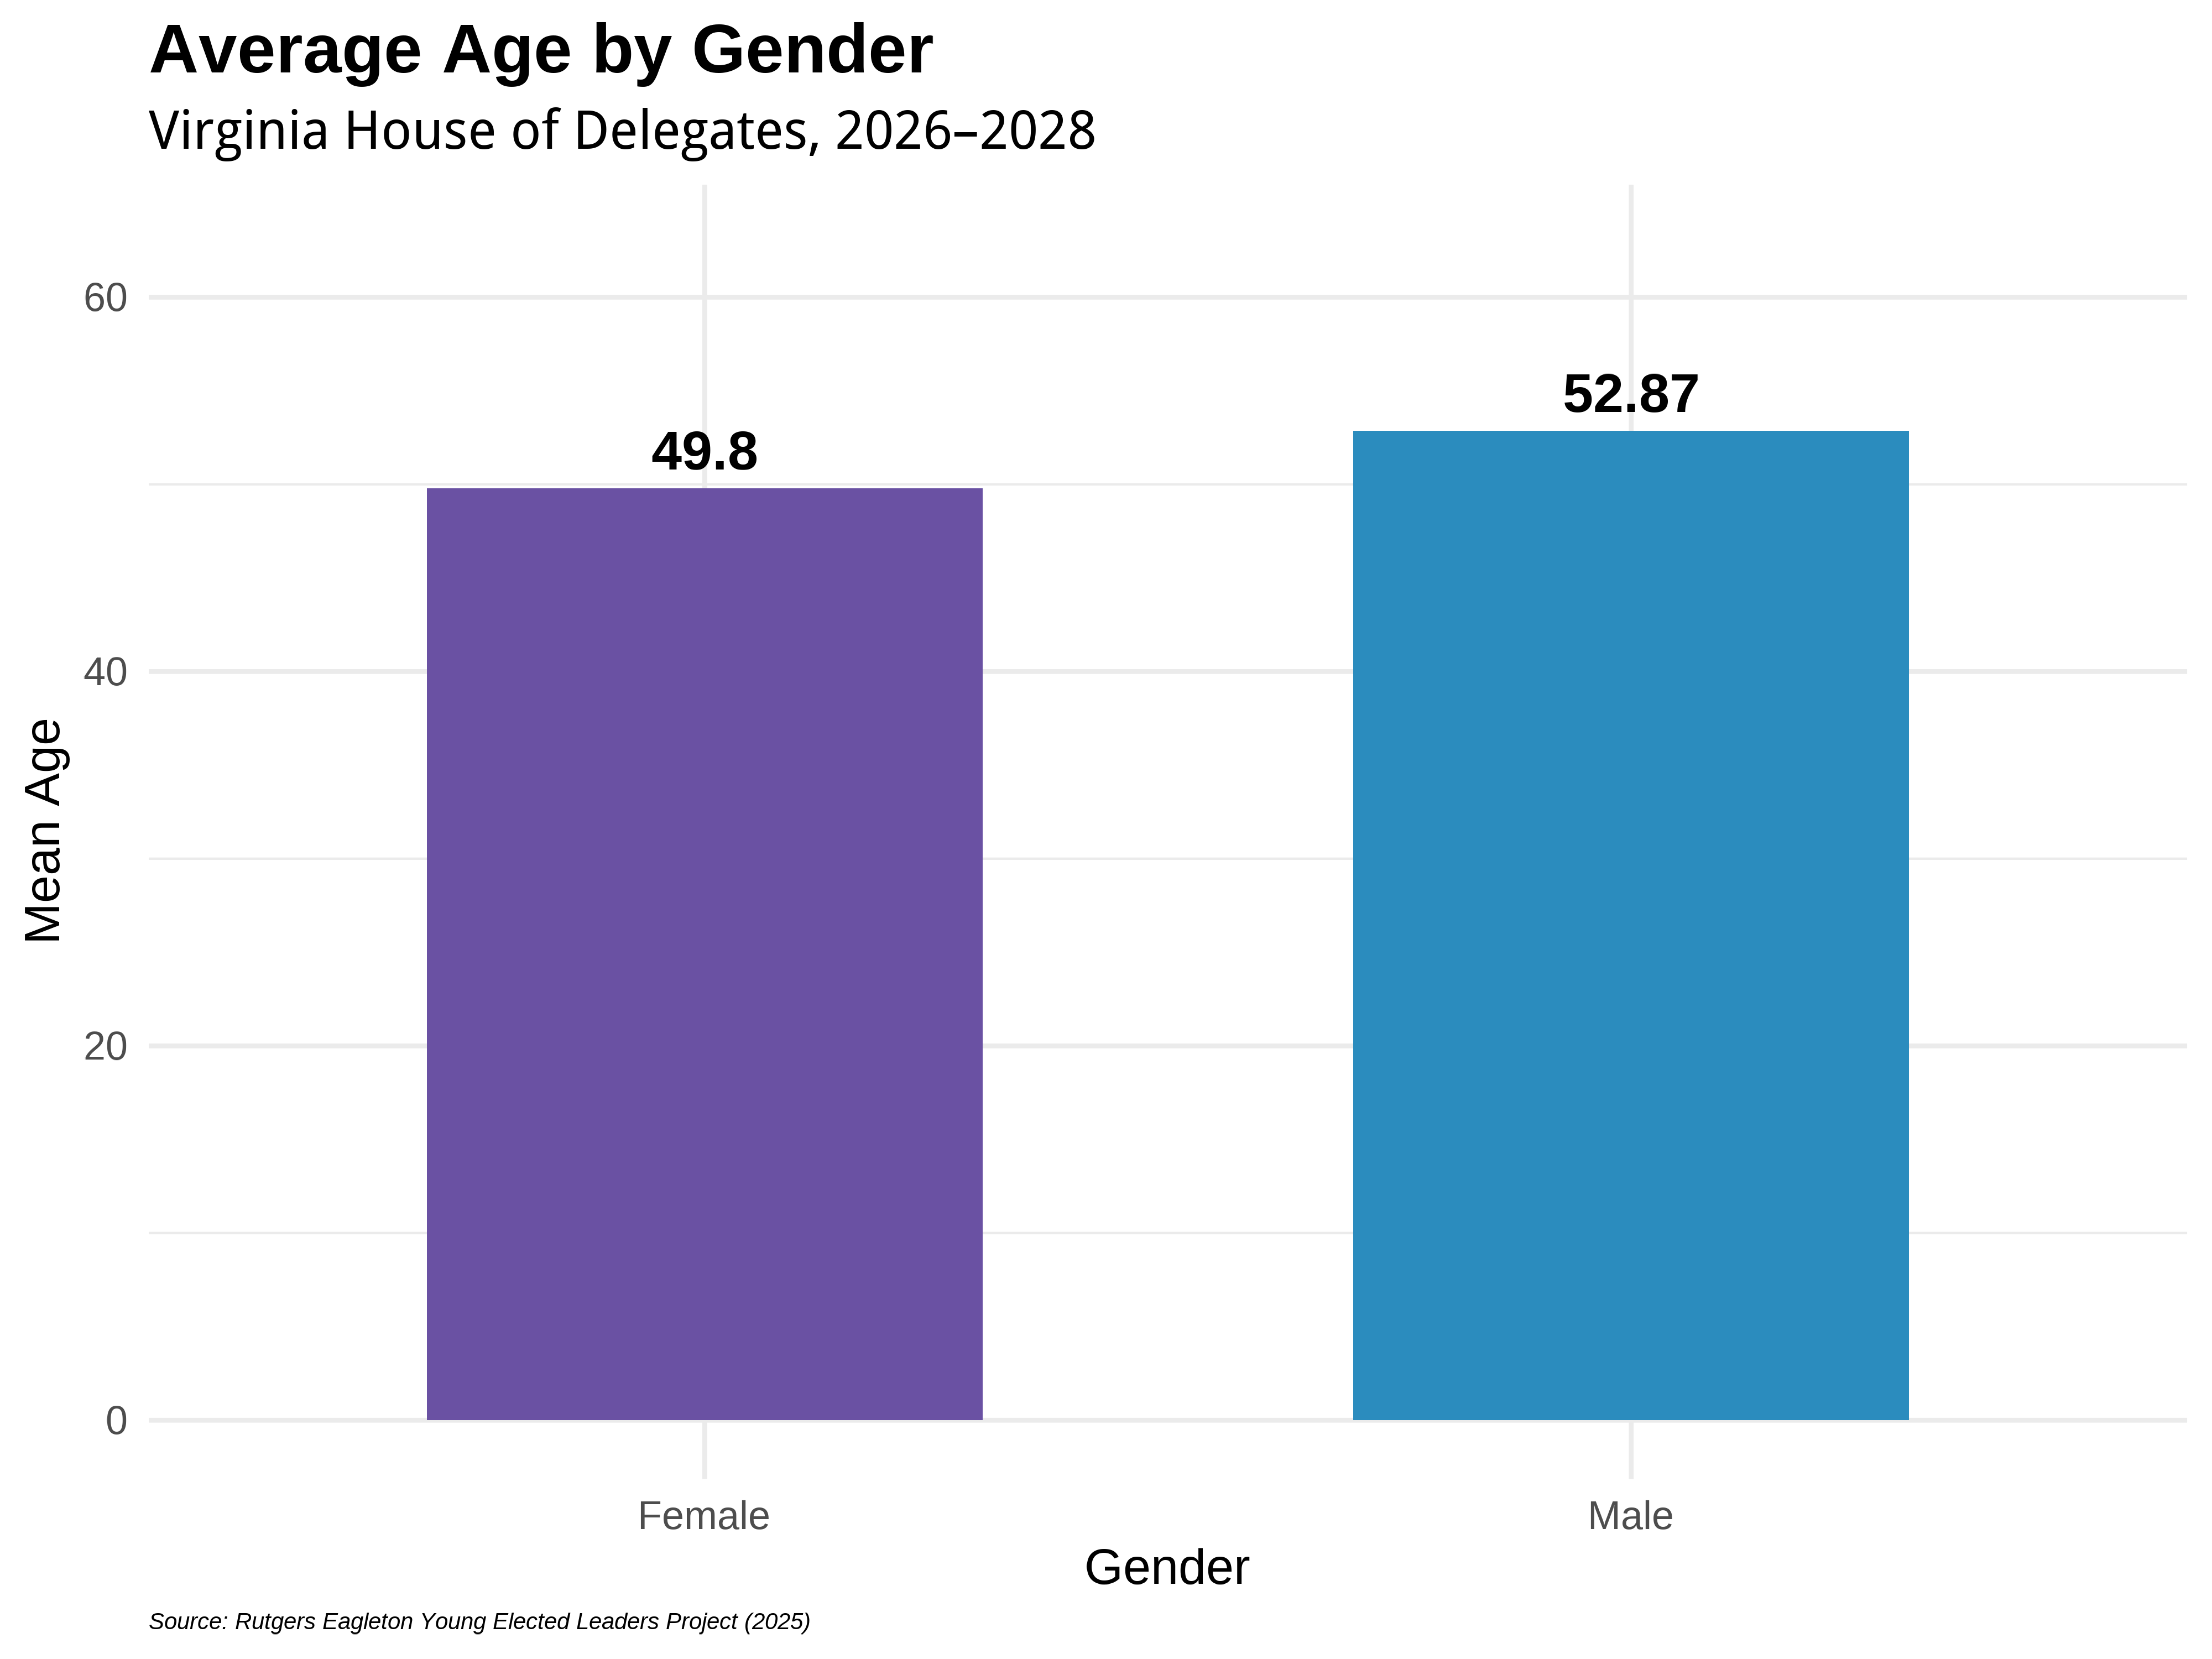
The Virginia House of Delegates reflects a range of age and gender dynamics that shape the composition of the state’s legislative body. In the current chamber, men make up 58% of members, while women account for 42%. The average age at the time of the election was 49.8 for female legislators and 52.87 for male legislators. Of the 10 Young Elected Leaders elected in 2025, six are male, and four are female, highlighting how youth and gender representation intersect within the Assembly.
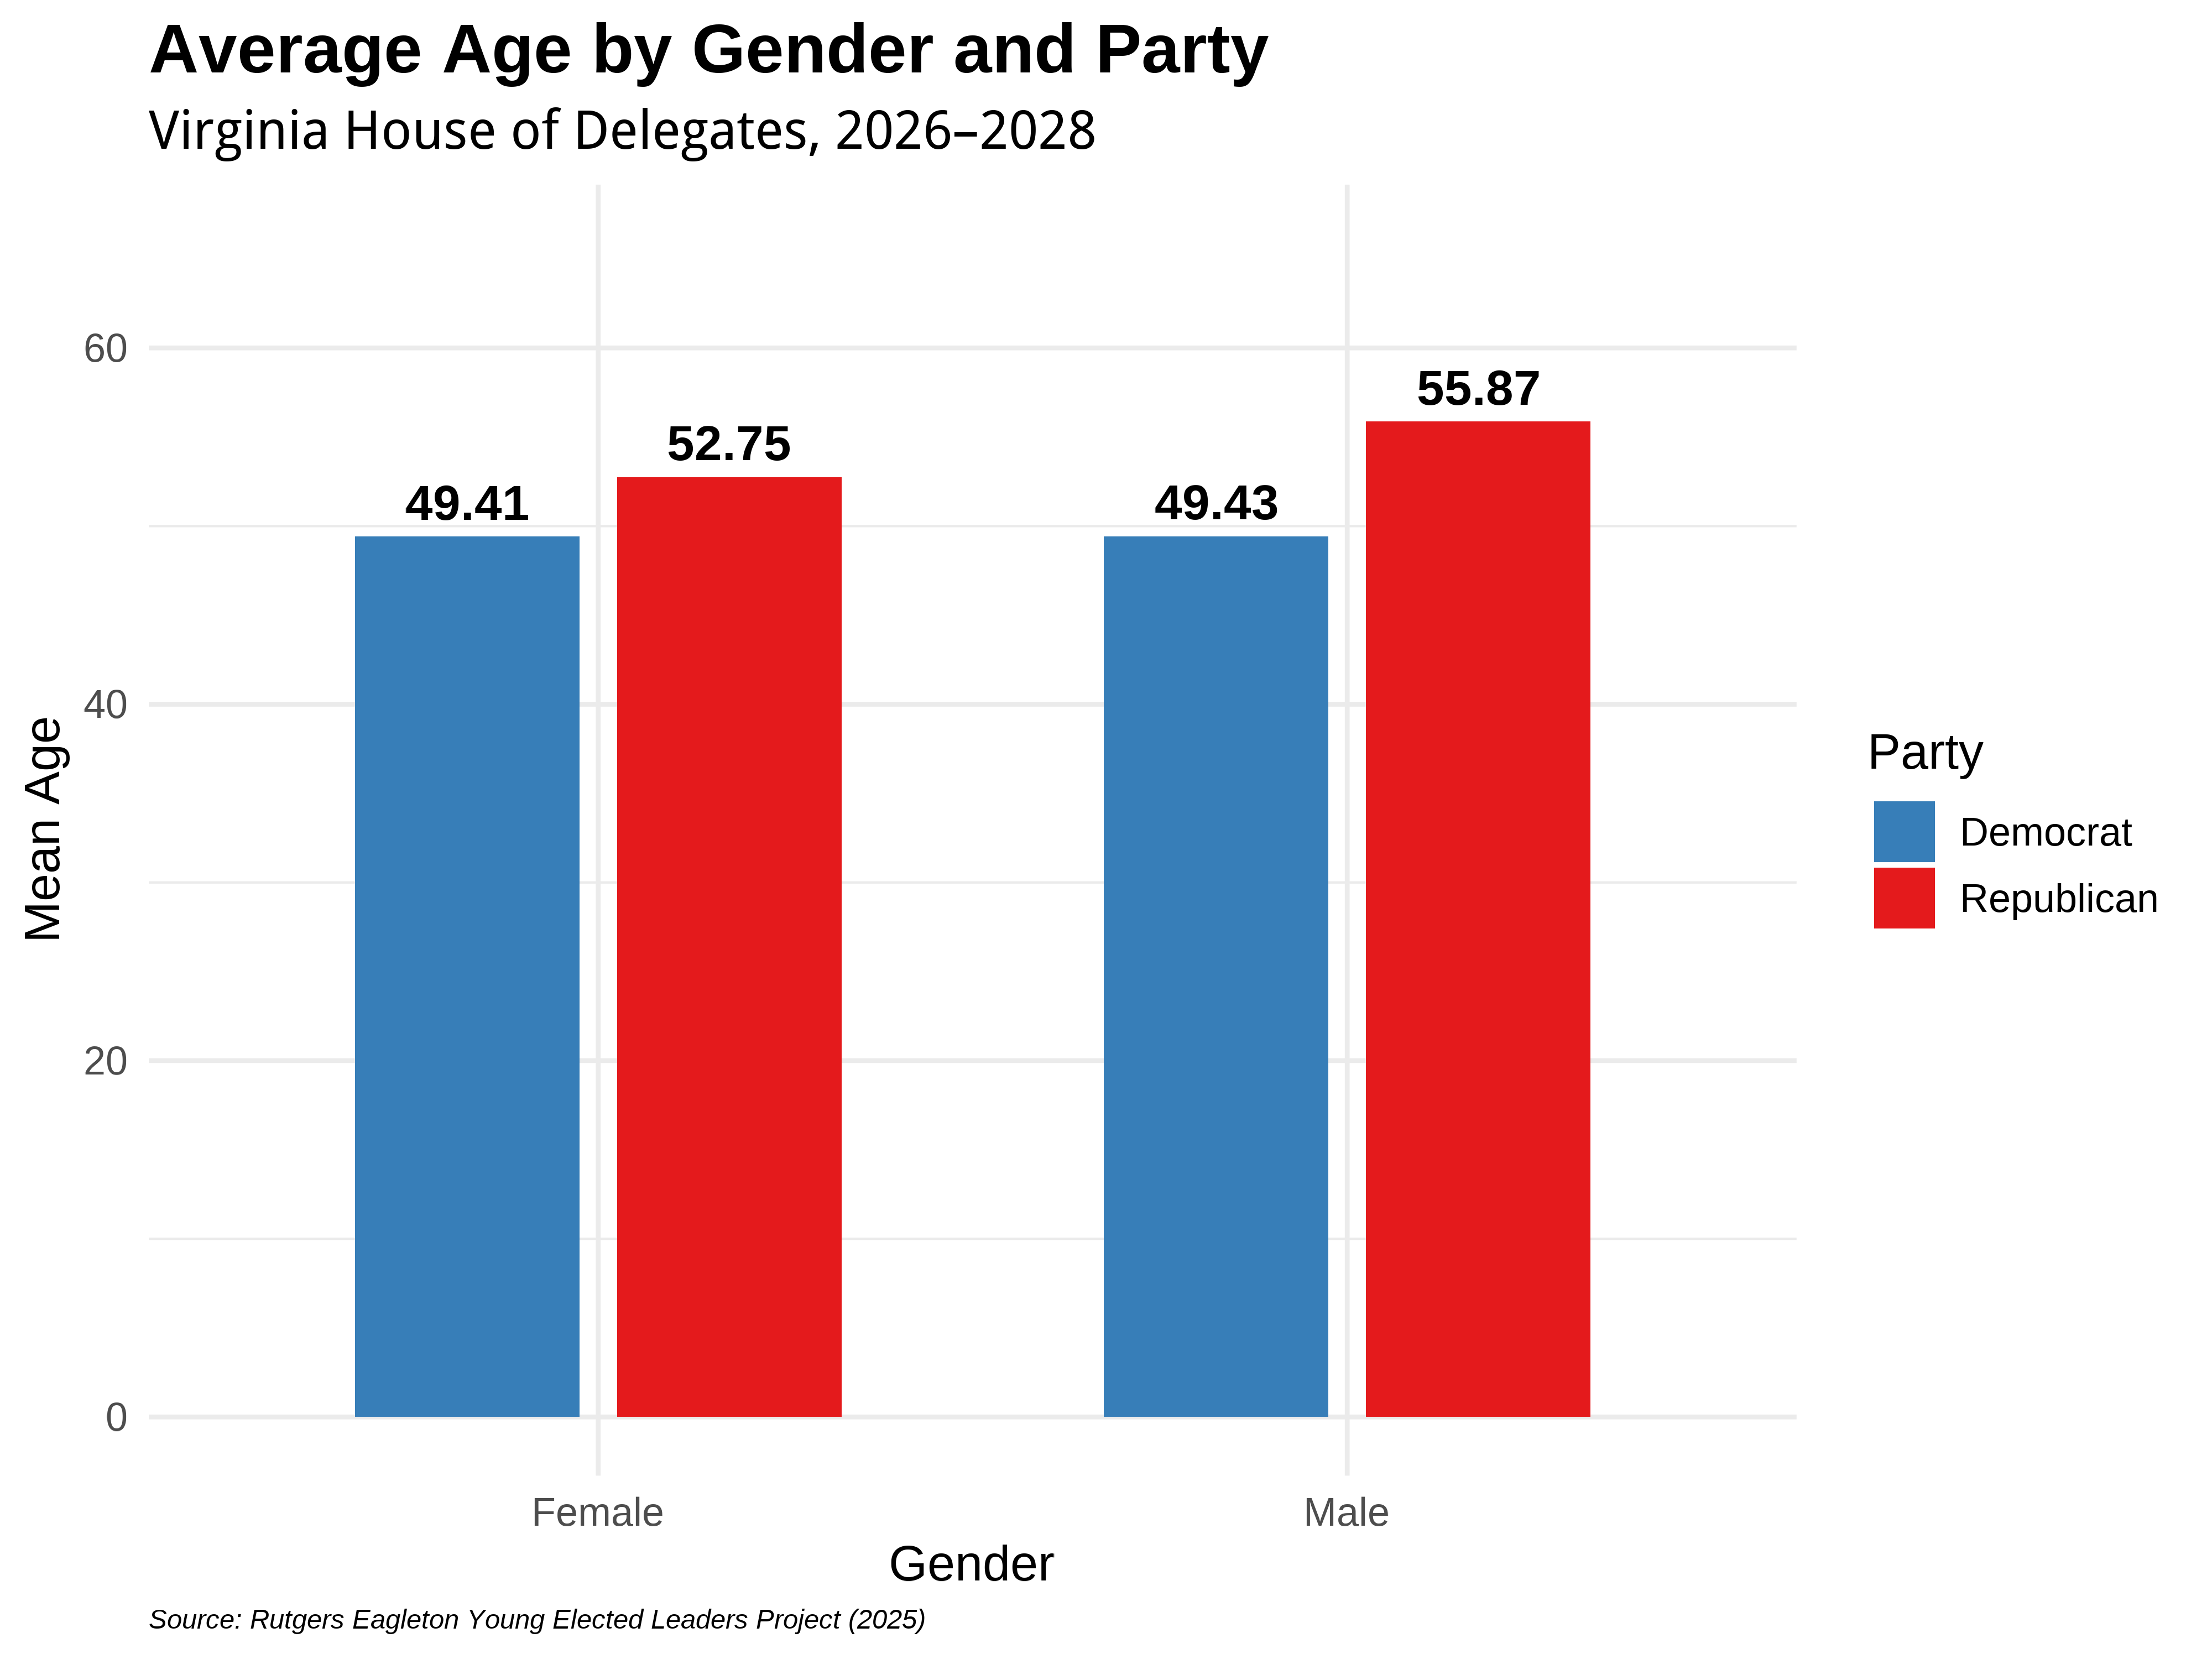
When examining both gender and party affiliation, additional age differences emerge within the Virginia House of Delegates. Among women legislators, Democratic members have an average age of 49.41, compared to 52.75 for Republican women. Among men, Republican members are also older on average, with a mean age of 55.87, while Democratic men average 49.43. These patterns indicate that Republican legislators in Virginia tend to be older than their Democratic counterparts across both genders, highlighting distinct generational profiles within each party’s delegation.
Race and Ethnicity in the Virginia House of Delegates
The racial and ethnic composition of the 2025 Virginia House of Delegates varies across generational cohorts. While the chamber overall remains predominantly White, younger legislators reflect comparatively greater diversity. Millennial and Generation X members include broader representation across racial and ethnic groups, including Black/African American, Hispanic/Latino, Asian/Pacific American, and Indian/Native American legislators.
Race and Ethnicity in the Virginia House of Delegates
| Ethnicity | Millennial Generation 1981–1996 |
Generation X 1965–1980 |
Boomer Generation 1946–1964 |
Silent Generation 1928–1945 | Full Chamber |
|---|---|---|---|---|---|
| Asian/Pacific American | 1 (2.94%) | 3 (8.11%) | 0 (0%) | 0 (0%) | 4 (4%) |
| Black/African American | 11 (32.35%) | 9 (24.32%) | 6 (21.43%) | 0 (0%) | 26 (26%) |
| Hispanic/Latino | 1 (2.94%) | 2 (5.41%) | 1 (3.57%) | 0 (0%) | 4 (4%) |
| Other | 1 (2.94%) | 0 (0%) | 0 (0%) | 0 (0%) | 1 (1%) |
| Two or More Ethnicities | 4 (11.76%) | 0 (0%) | 0 (0%) | 0 (0%) | 4 (4%) |
| White / Caucasian | 16 (47.06%) | 23 (62.16%) | 21 (75%) | 1 (100%) | 61 (61%) |
| Total (Percent of Chamber) | 34 (34%) | 37 (37%) | 28 (28%) | 1 (1%) | 100 (100%) |
The full Virginia House of Delegates consists of 100 members
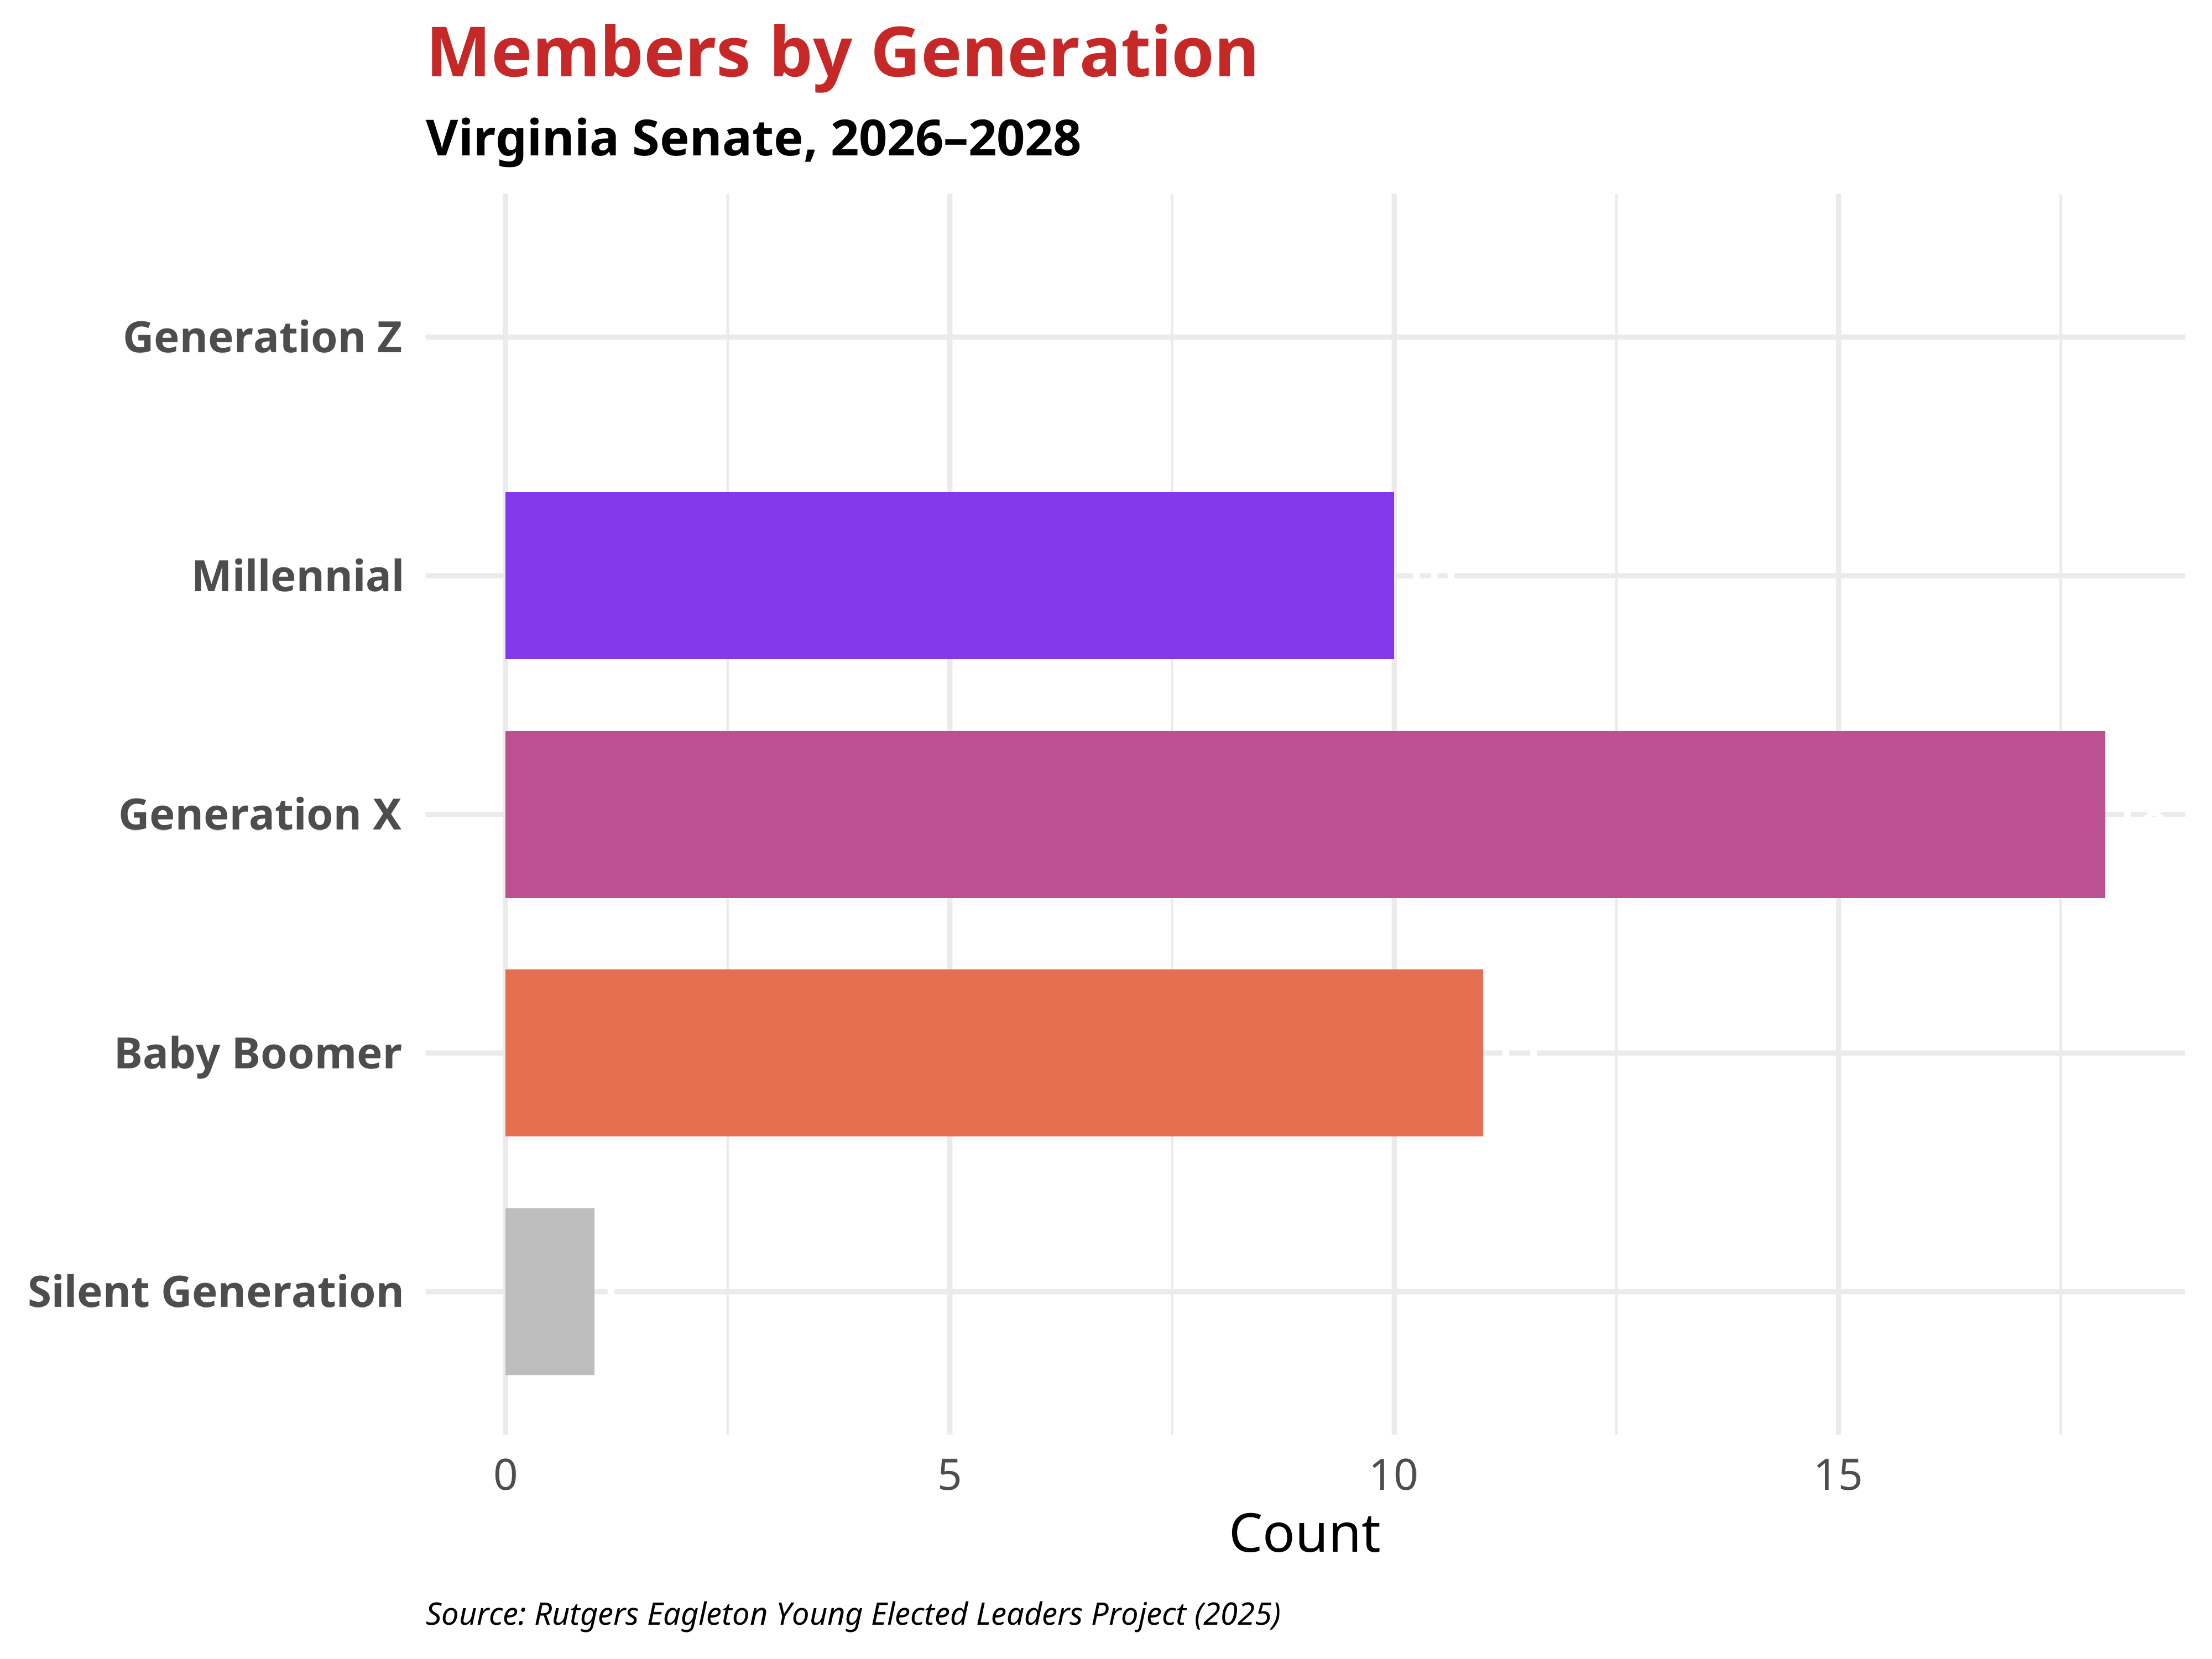
The Virginia Senate
Below is information covering age dynamics in the recently elected Virginia Senate
- The average age of Virginia State Senators is 54.13 years
- The youngest Senator is Saddam Azlan Salim, born in 1990
- The oldest Senator is Lillie Louise Lucas, born in 1944
- One member of the Virginia State Senate qualifies as a Young Elected Leader, age 35 or younger on Election Day 2025.
Young Elected Senators in the Virginia State Senate
Following the 2025 State Legislative Elections in Virginia, one member aged 35 or under was elected to (and currently serving in) the Virginia State Senate.
Young Elected Representatives — Virginia State Senate (Age ≤ 35)
| Name | District | Birth Year (Age on Election Day 2024) | First Elected | |
|---|---|---|---|---|
 |
Saddam Azlan Salim (D) | District 37 — Fairfax, VA | 1990 (Age 35) | 2023 |
Photos Courtesy of the Virginia State member roster
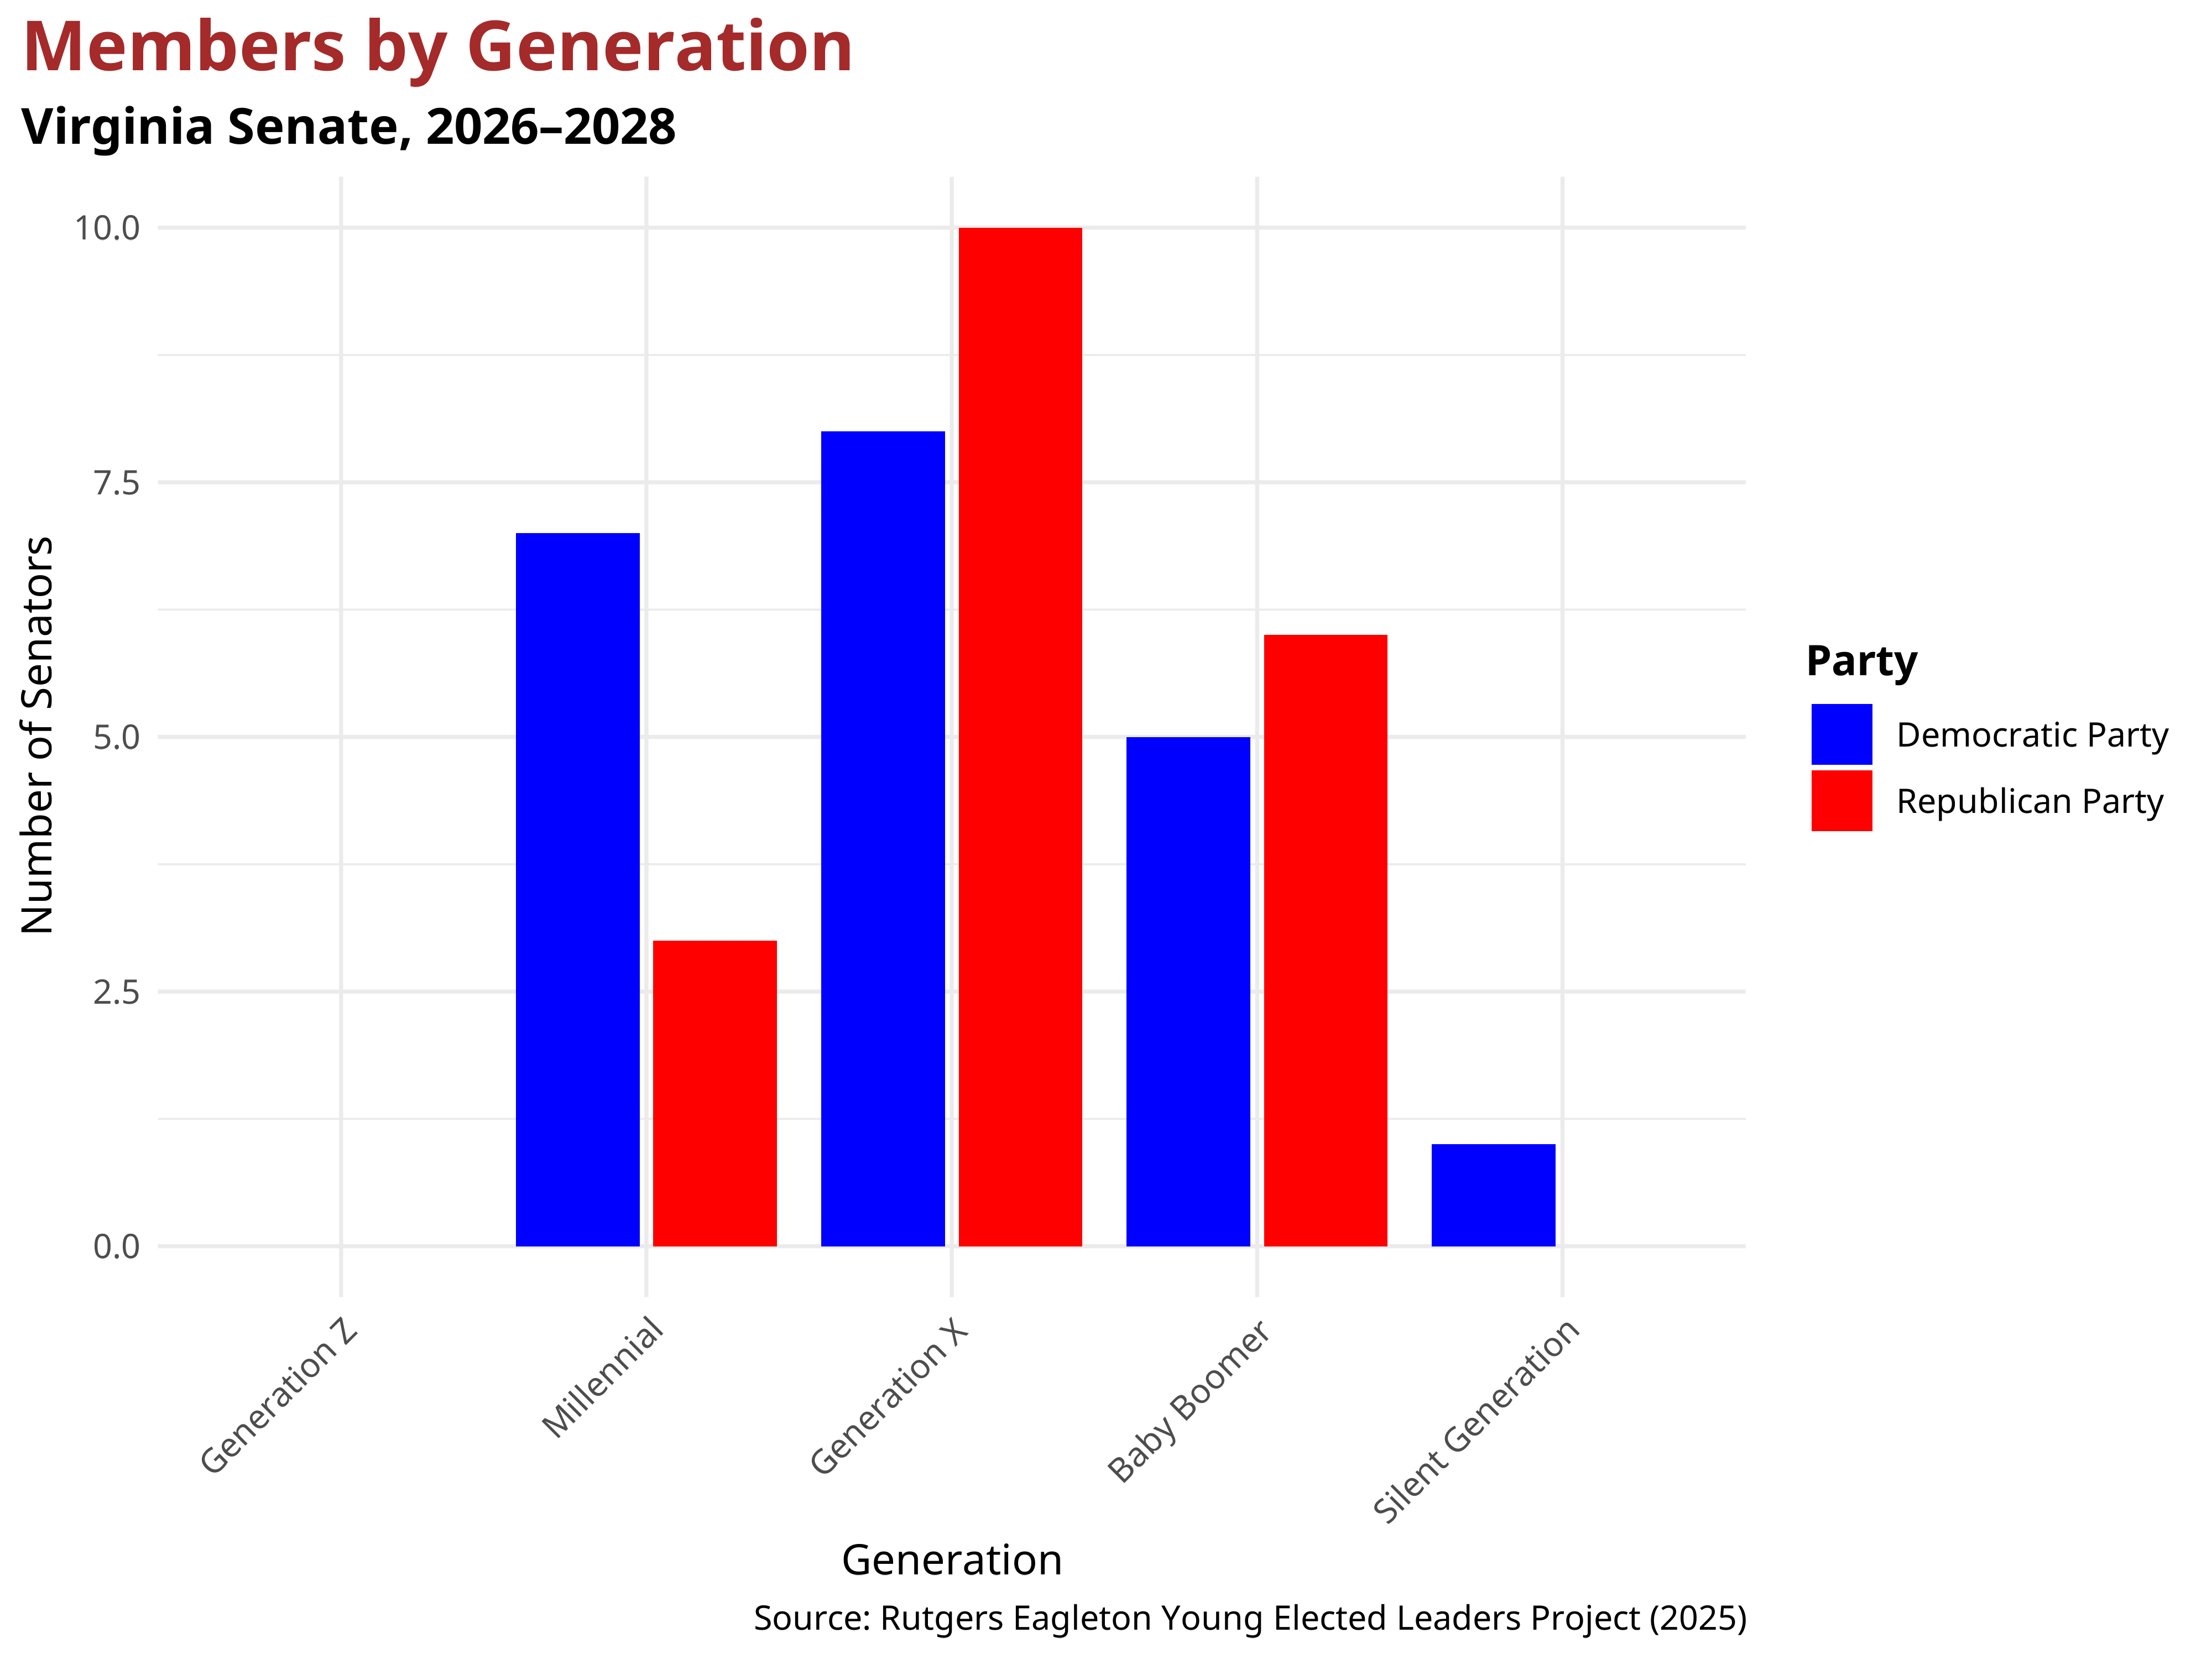
Partisanship in the Virginia State Senate
In the Virginia State Senate, 19 senators are Republicans, and 21 are Democrats. Following the 2025 election, the average age of Democratic senators was 53.64, while Republican senators had a slightly higher average age of 54.67, reflecting only a modest partisan age gap. Despite this similarity, the chamber’s overall generational profile remains concentrated among Millennials, Baby Boomers, and Generation X members, with little to no representation from younger cohorts. The breakdown below illustrates how party affiliation is distributed across generations within the Virginia State Senate.
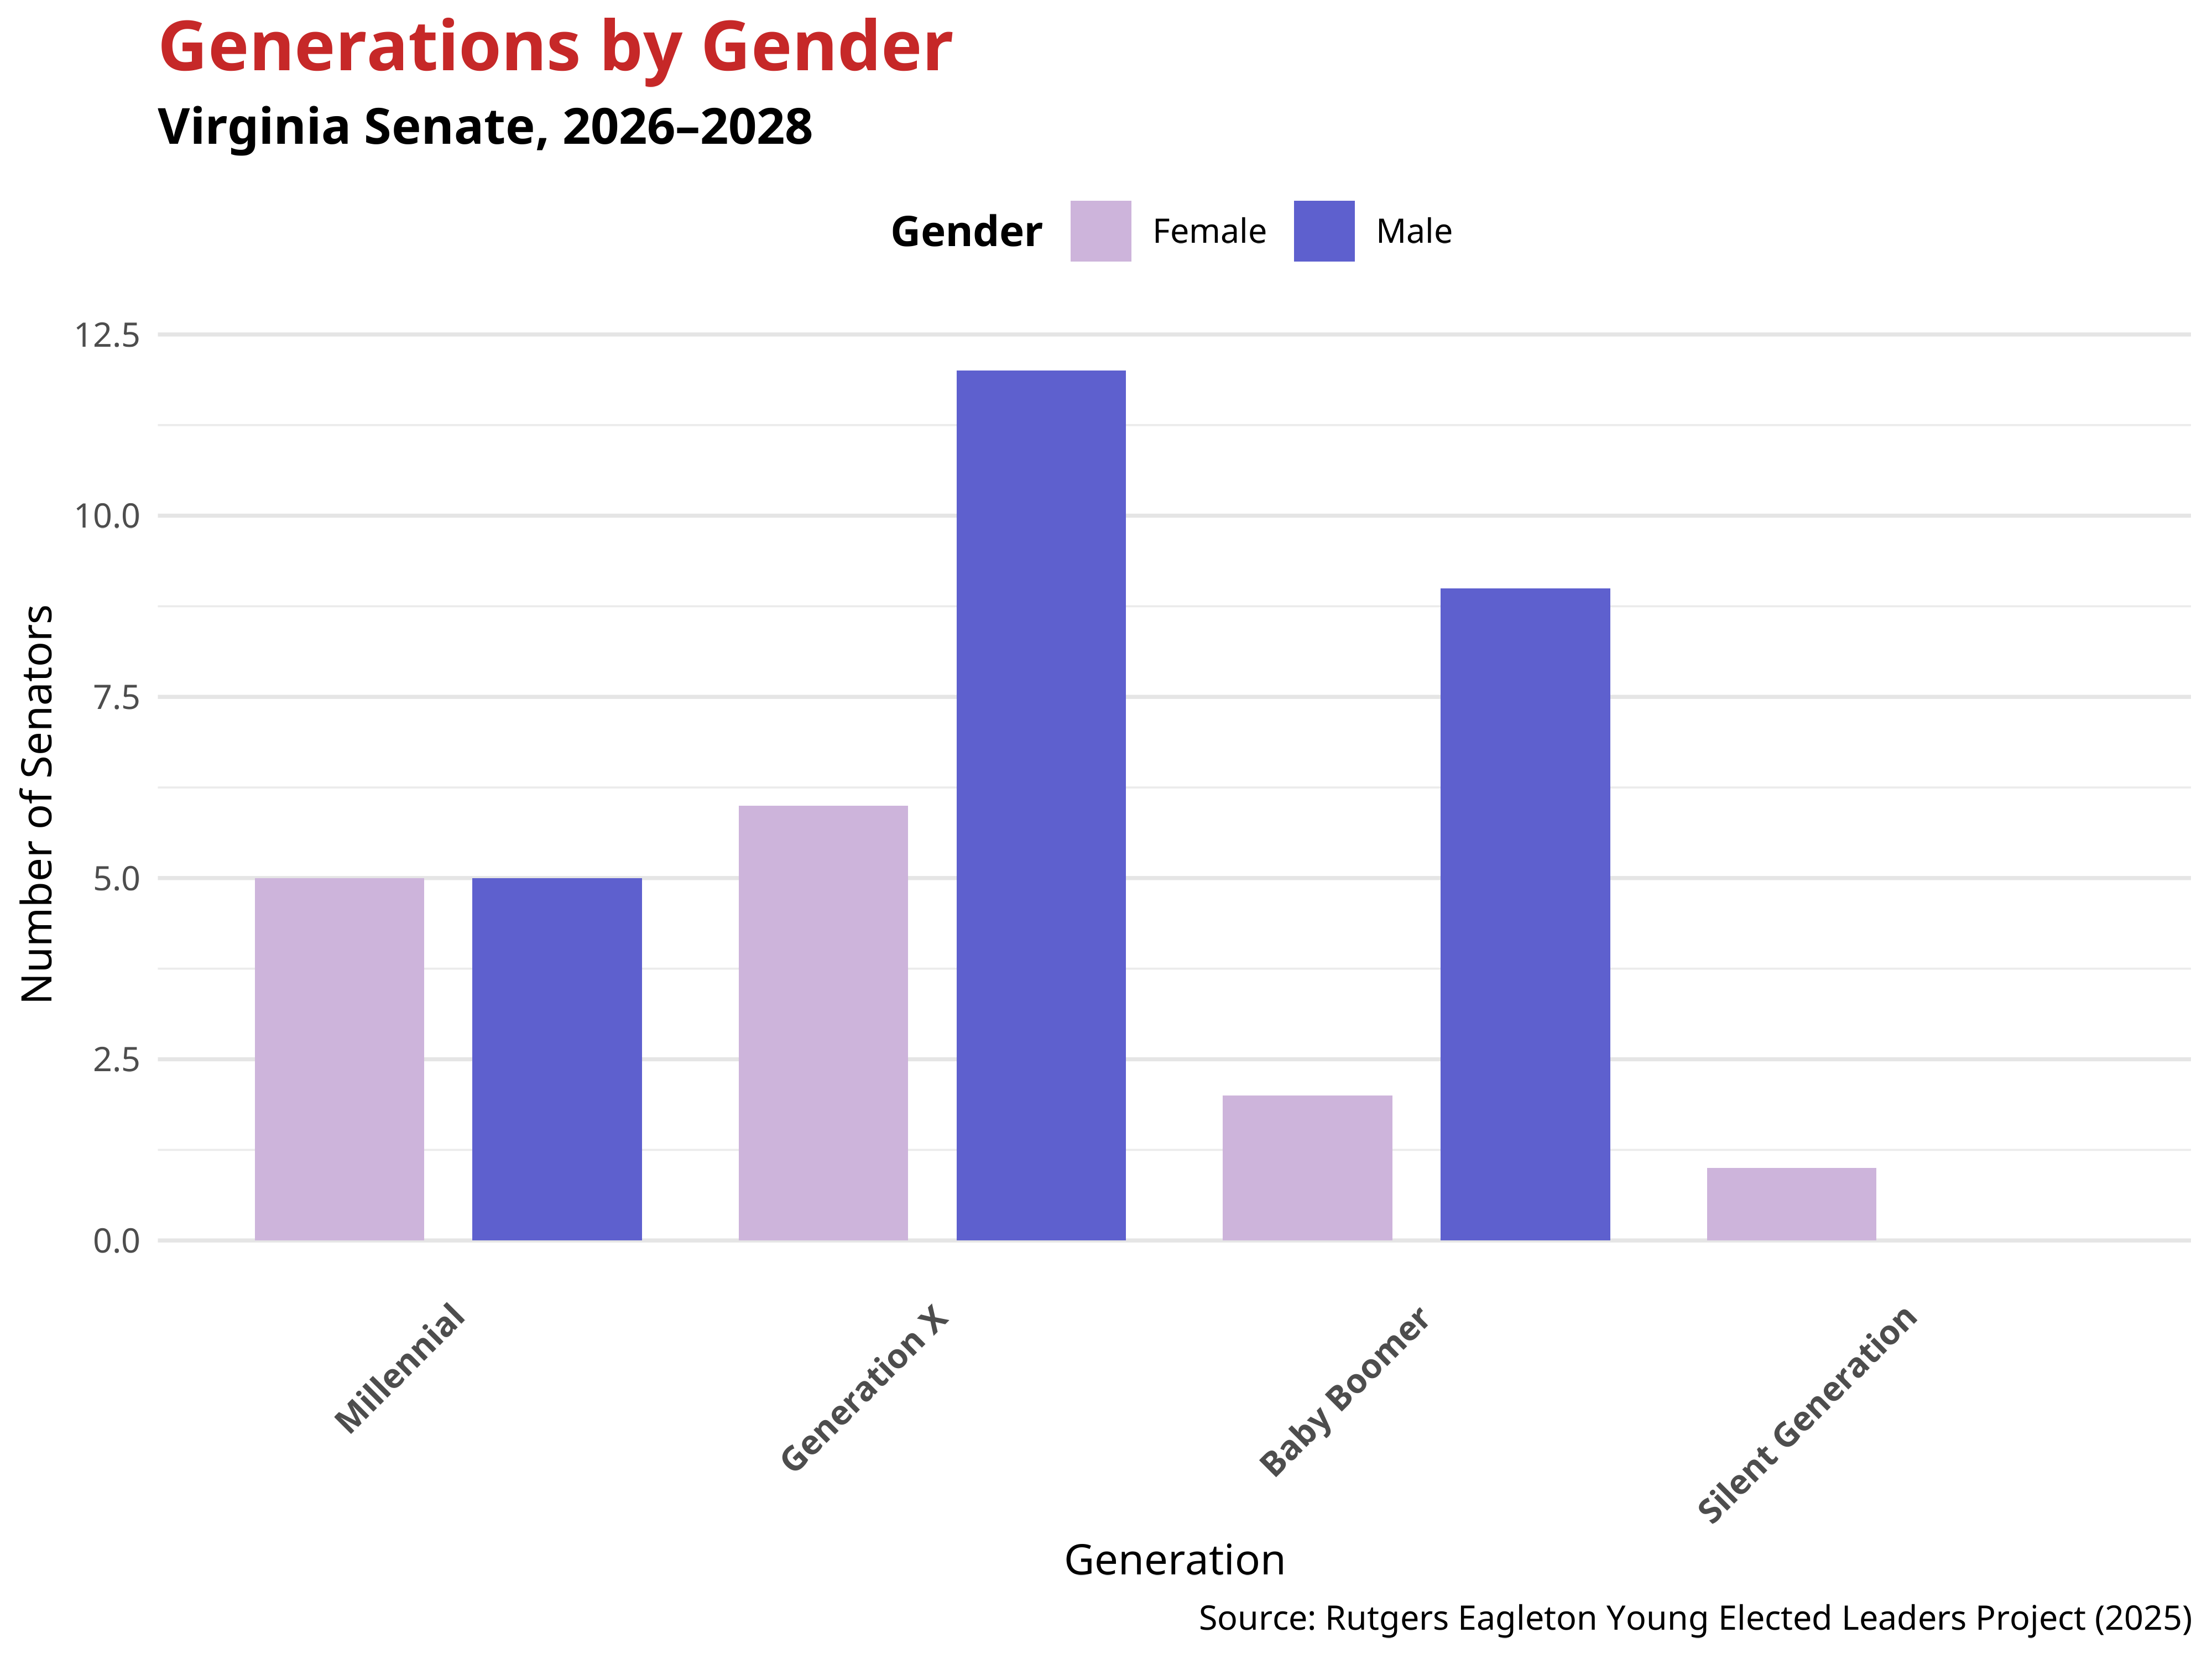
Gender in the Virginia Senate
The generational makeup of the Virginia Senate reveals notable gender dynamics. Overall, men are overrepresented across all age groups, especially among older generations. These patterns indicate that gender representation varies across generations, with women being represented in every generational cohort.
Race and Ethnicity in the Virginia Senate
The racial and ethnic composition of the Virginia State Senate varies across generations, though the chamber overall remains predominantly White. Younger cohorts, particularly Millennials, reflect greater racial and ethnic diversity, with representation across multiple racial groups. Generation X members also include a mix of racial and ethnic backgrounds, though White legislators comprise a majority of that cohort. Among Baby Boomers and members of the Silent Generation, the Senate is less diverse, with White senators making up a larger share of those generations. While signs of demographic change are visible among younger senators, older generations continue to shape the chamber’s overall racial and ethnic profile.
Generations by Race/Ethnicity in the Virginia Senate
| Ethnicity | Millennial Generation 1981–1996 |
Generation X 1965–1980 |
Boomer Generation 1946–1964 |
Silent Generation 1928–1945 | Full Chamber |
|---|---|---|---|---|---|
| Asian/Pacific American | 0 (0%) | 1 (5.56%) | 0 (0%) | 0 (0%) | 1 (2.5%) |
| Black/African American | 3 (30%) | 3 (16.67%) | 1 (9.09%) | 1 (100%) | 8 (20%) |
| Indian/Native American | 1 (10%) | 0 (0%) | 0 (0%) | 0 (0%) | 1 (2.5%) |
| Two or More Ethnicities | 0 (0%) | 1 (5.56%) | 0 (0%) | 0 (0%) | 1 (2.5%) |
| White/Caucasian | 6 (60%) | 13 (72.22%) | 10 (90.91%) | 0 (0%) | 29 (72.5%) |
| Total (Percent of Chamber) | 10 (25%) | 18 (45%) | 11 (27.5%) | 1 (2.5%) | 40 (100%) |
The full Virginia State Senate comprises 40 seats.
Notes
The Young Elected Leaders Project applies the generational categorization of the Pew Research Center:
- Silent Generation: 1928 – 1945
- Baby Boomer Generation: 1946 – 1964
- Generation X: 1965 – 1980
- Millennial Generation: 1981 – 1996
- Generation Z: 1997 – 2012
This analysis is based on data from the most recent state legislative election in Virginia, which took place on November 4th 2025.
Citation Guideline
In referencing the Young Elected Leaders Project in publication please use the following language: “The Young Elected Leaders Project is housed at the Center for Youth Political Participation at The Eagleton Institute of Politics, Rutgers University – New Brunswick.”
Bibliographic Citation For this document
Author: Young Elected Leaders Project
Corresponding Authors: George D. Quinn, Adil Khan
Year: 2025
Title: Age in the 2026 Virginia General Assembly