Connecticut General Assembly Snapshot
The State of Connecticut held its elections for a new state house and senate on November 4th 2024. On January 8th 151 state house members and 36 state senators were sworn into office by the Connecticut House Speaker Matt Ritter and began the currently active 2025 legislative session of the Connecticut General Assembly. Among the members elected 21 were aged 35 or younger on election day in 2024. Below is a map of these representatives within both chambers of the Connecticut General Assembly.
Connecticut Demographic Background in the 2024 Election
Preliminary estimates provided from CIRCLE at Tufts University indicate that 42% of young people aged 18-29 voted in the 2024 election, with turnout surpassing 50% in key battleground states. Nearly 50 million young citizens were eligible to vote, including over 8 million young voters who turned 18 since the 2022 midterms. According to the CIRCLE institutes – Youth Electoral Significance Index (YESI), Connecticut voters had strong political sway. For example, according to YESI the congressional race in Connecticut’s 5th ranked 32nd in the 50 most impacted by youth political participation.
Nationally, according to the Pew Research Center, Millennials in 2020 overtook Baby Boomers as the largest generation in the U.S., comprising 31% of the population, followed closely by Baby Boomers at 30.9%. Generation X makes up 28%, while the Silent Generation is the smallest at 9.9%.
This election showcased the increasing diversity of the youth electorate, with notable differences in voting patterns by race, gender, and issue priorities. Given Connecticut’s unique demographics, voters elected 21 members to the Connecticut General Assembly, who were age 35 and under on election day. Below is information about the generational backgrounds of the current Connecticut State Legislature.
The Connecticut House of Representatives 2025 Legislative Session
Below is information covering age dynamics in the recently elected to the Connecticut House of Representatives
- the average age of Connecticut House of Representatives members is 52.48 years
- the youngest Representatives are Daniel Gaiewski and Michael Shannon both born in 2000
- the oldest Representative Carol Hall was born in 1937
- 20 Representatives are Young Elected Leaders age 35 or younger as of Election Day 2024
Generational Breakdown
Within the Connecticut House of Representatives, all representatives come from the Millennial, Generation X, Baby Boomer generation. Importantly, only a few members of the current Connecticut House of Representatives belong to Generation Z (youngest) or the Silent Generation (oldest). Scroll below to see the generations in the Connecticut House of Representatives visualized.

Partisanship in the Connecticut House of Representatives
The chart below further breaks down the current partisan makeup of the 2025 Connecticut House of Representatives. Each dot represents a single member, colored by both party affiliation and whether the legislator qualifies as a Young Elected Leader (YEL)—defined as age 35 or younger at the time of the election. This format provides a visual snapshot of generational and partisan distribution within the chamber, highlighting how younger legislators are positioned across party lines.
Partisan dynamics in the Connecticut House of Representatives reflect not only ideological differences but also generational contrasts. The visual below highlights one key distinction: the average age of legislators by party. While both parties include a mix of experience levels, Republican members are, on average, older than their Democratic counterparts. This difference may reflect broader trends in political recruitment, generational turnover, and candidate emergence in recent election cycles.

Young Elected Representatives – Connecticut House of Representatives
Following the 2024 State Legislative Elections in Connecticut, twenty members aged 35 or under were elected to the Connecticut House of Representatives. Below are all twenty of these members along with information about their local districts and party affiliation.
| Name | District | Birth year (Age on Election Day) | Year first elected to Connecticut House | |
|---|---|---|---|---|
 |
Daniel Gaiewski (D) | 40th District –
New London, CT |
2000 (Age 24) | 2025* |
 |
Michael Shannon (D) | 117th District –
Milford, CT |
2000 (Age 24) | 2024 |
 |
Joseph Canino (R) | 65th District –
Torrington, CT |
1997 (Age 27) | 2024 |
 |
Antonio Dario Felipe (D) | 130th District –
Bridgeport, CT |
1996 (Age 28) | 2019* |
 |
Aundre Bumgardner (D) | 41st District –
Groton, CT |
1994 (Age 30) | 2022 |
 |
Jonathan Fazzino (D) | 83rd District –
Berlin, CT |
1994 (Age 30) | 2022 |
 |
Trenee McGee (D) | 116th District –
West Haven, CT |
1994 (Age 30) | 2021* |
 |
Hubert Douglas Delany III (D)
|
144th District –
Stamford, CT |
1993 (Age 30) | 2022 |
 |
Joe Hoxha (R)
|
78th District –
Bristol, CT |
1993 (Age 31) | 2022 |
 |
Derell Wilson (D)
|
46th District –
Norwich, CT |
1992 (Age 32) | 2022 |
 |
Corey Paris (D)
|
145th District –
Stamford, CT |
1991 (Age 33) | 2021* |
 |
Kadeem Roberts (D)
|
137th District –
Norwalk, CT |
1991 (Age 33) | 2022 |
 |
Marcus Brown (D)
|
127th District –
Bridgeport, CT |
1991 (Age 33) | 2022 |
 |
Raghib Allie-Brennan (D)
|
2nd District –
Bethel, CT |
1991 (Age 33) | 2018 |
 |
Jaime Foster (D)
|
57th District –
Ellington, CT |
1990 (Age 34) | 2020 |
 |
Farley Santos (D)
|
109th District –
Danbury, CT |
1989 (Age 35) | 2022 |
 |
John-Michael Parker (D)
|
101st District –
Madison, CT |
1989 (Age 35) | 2020 |
 |
Nick Menapace (D)
|
37th District –
Niantic, CT |
1989 (Age 35) | 2024 |
 |
Seth Bronko (R)
|
70th District –
Naugatuck, CT |
1989 (Age 35) | 2022 |
 |
Steven Winter (D)
|
94th District – New Haven, CT | 1989 (Age 35) | 2024 |
Photos courtesy of Connecticut General Assembly member roster
* Member first elected during a special election
Gender in the Connecticut House of Representatives
The Connecticut House of Representatives reflects a range of age and gender dynamics that help shape the composition of the state’s legislative body. Across all members, 63.58% are men, while women make up the remaining 36.42%. Age differences between these groups are notable: female representatives had an average age of 55.71 at the time of the election, compared to 50.58 for their male colleagues.

When examining both gender and party affiliation, additional differences in age emerge within the Connecticut House of Representatives. Democratic men have the lowest average age of the four groups at 49.37, while Republican men have a higher average age of 52.95. For women in the Connecticut House of Representatives, both parties are on average older, with Democratic women averaging 53.91 and Republican women averaging the highest age among these groups at 59.99. These patterns show that age representation in the Connecticut House of Representatives varies by both gender and partisan alignment, highlighting differing pathways to political office across demographic groups.

Race and Ethnicity in the Connecticut House of Representatives
The racial and ethnic composition of the Connecticut House of Representatives varies significantly across generations. For example, among Millennials and Silent Generation members African American legislators account for a larger than expected share, totaling 19% among Millennial members and 33% of Silent generation members respectively. This table highlights how race and ethnicity intersect with age in shaping the diversity of the legislative body.
Generations by Race/Ethnicity in the Connecticut House of Representatives
|
Generation Z 1997 – |
Millennial Generation
1981 – 1996 |
Generation X
1965 –1980 |
Boomer Generation
1946 – 1964 |
Silent Generation
1928 – 1945 |
Full Chamber | |
|---|---|---|---|---|---|---|
| White/Caucasian | 3
(100%) |
28
(66.67%) |
46
(83.64%) |
35
(81.40%) |
2
(66.67%) |
114
(78.08%) |
| Black/African American | – | 8
(19.05%) |
6
(10.91%) |
2
(4.65%) |
1
(33.33%) |
17
(11.64%) |
| Hispanic/Latino | – | 3
(7.14%) |
3
(5.45%) |
6
(13.95%) |
– | 12
(8.22%) |
| Other | – | 2
(4.76%) |
– | – | – | 2
(1.37%) |
| Two or More Ethnicities | – | 1
(2.38%) |
– | – | – | 1
(0.68%) |
| Total (Precent of Connecticut House) | 3
(2.05%) |
42
(28.77%) |
55
(37.67%) |
43
(29.45%) |
3
(2.05%) |
146*
(100%) |
*Five House member’s ages are currently missing
The Connecticut Senate
Below is information covering age dynamics in the recently elected Connecticut State Senate.
- the average age of Connecticut State Senate members is 56.17 years
- the youngest Senator Ryan Fazio who was born in 1990
- the oldest Senator Martin Looney who was born in 1948
- 1 Senator is a Young Elected Leader, aged 35 or younger as of Election Day 2024
Young Elected Senators in the Connecticut State Senate
Following the 2024 State Legislative Elections in Connecticut, one member was aged 35 or under were elected to the Connecticut State Senate. Below is information about their local districts and party affiliation.
| Name | District | Birth Year
(Age on Election Day) |
Year First Elected to the Connecticut State Senate |
|
|---|---|---|---|---|
 |
Ryan Fazio (R) | 36th District – Greenwich, CT | 1990 (Age 34) |
2021 |
Photos courtesy of Connecticut State Senate member roster
In the Connecticut State Senate, 25 senators belong to the Democratic Party, and 11 senators are Republicans. The mean age of Democratic state senators after the 2024 election was 57.72, while the mean age of Republican state senators was 52.63. Each generation had a different partisan makeup. Below is the breakdown of party composition for each generation within the Connecticut State Senate.

Gender in the Connecticut Senate
The generational makeup of the Connecticut Senate also reflects important gender dynamics. Across generations, gender balance is more male skewed across generations. Younger generations, such as Millennials and Generation X, include more men than women, while older generations, such as Baby Boomers, have more more gender balance. These patterns suggest that gender balance varies across generational lines, with women represented in each age cohort of the Connecticut Senate.

Race and Ethnicity in the Connecticut Senate
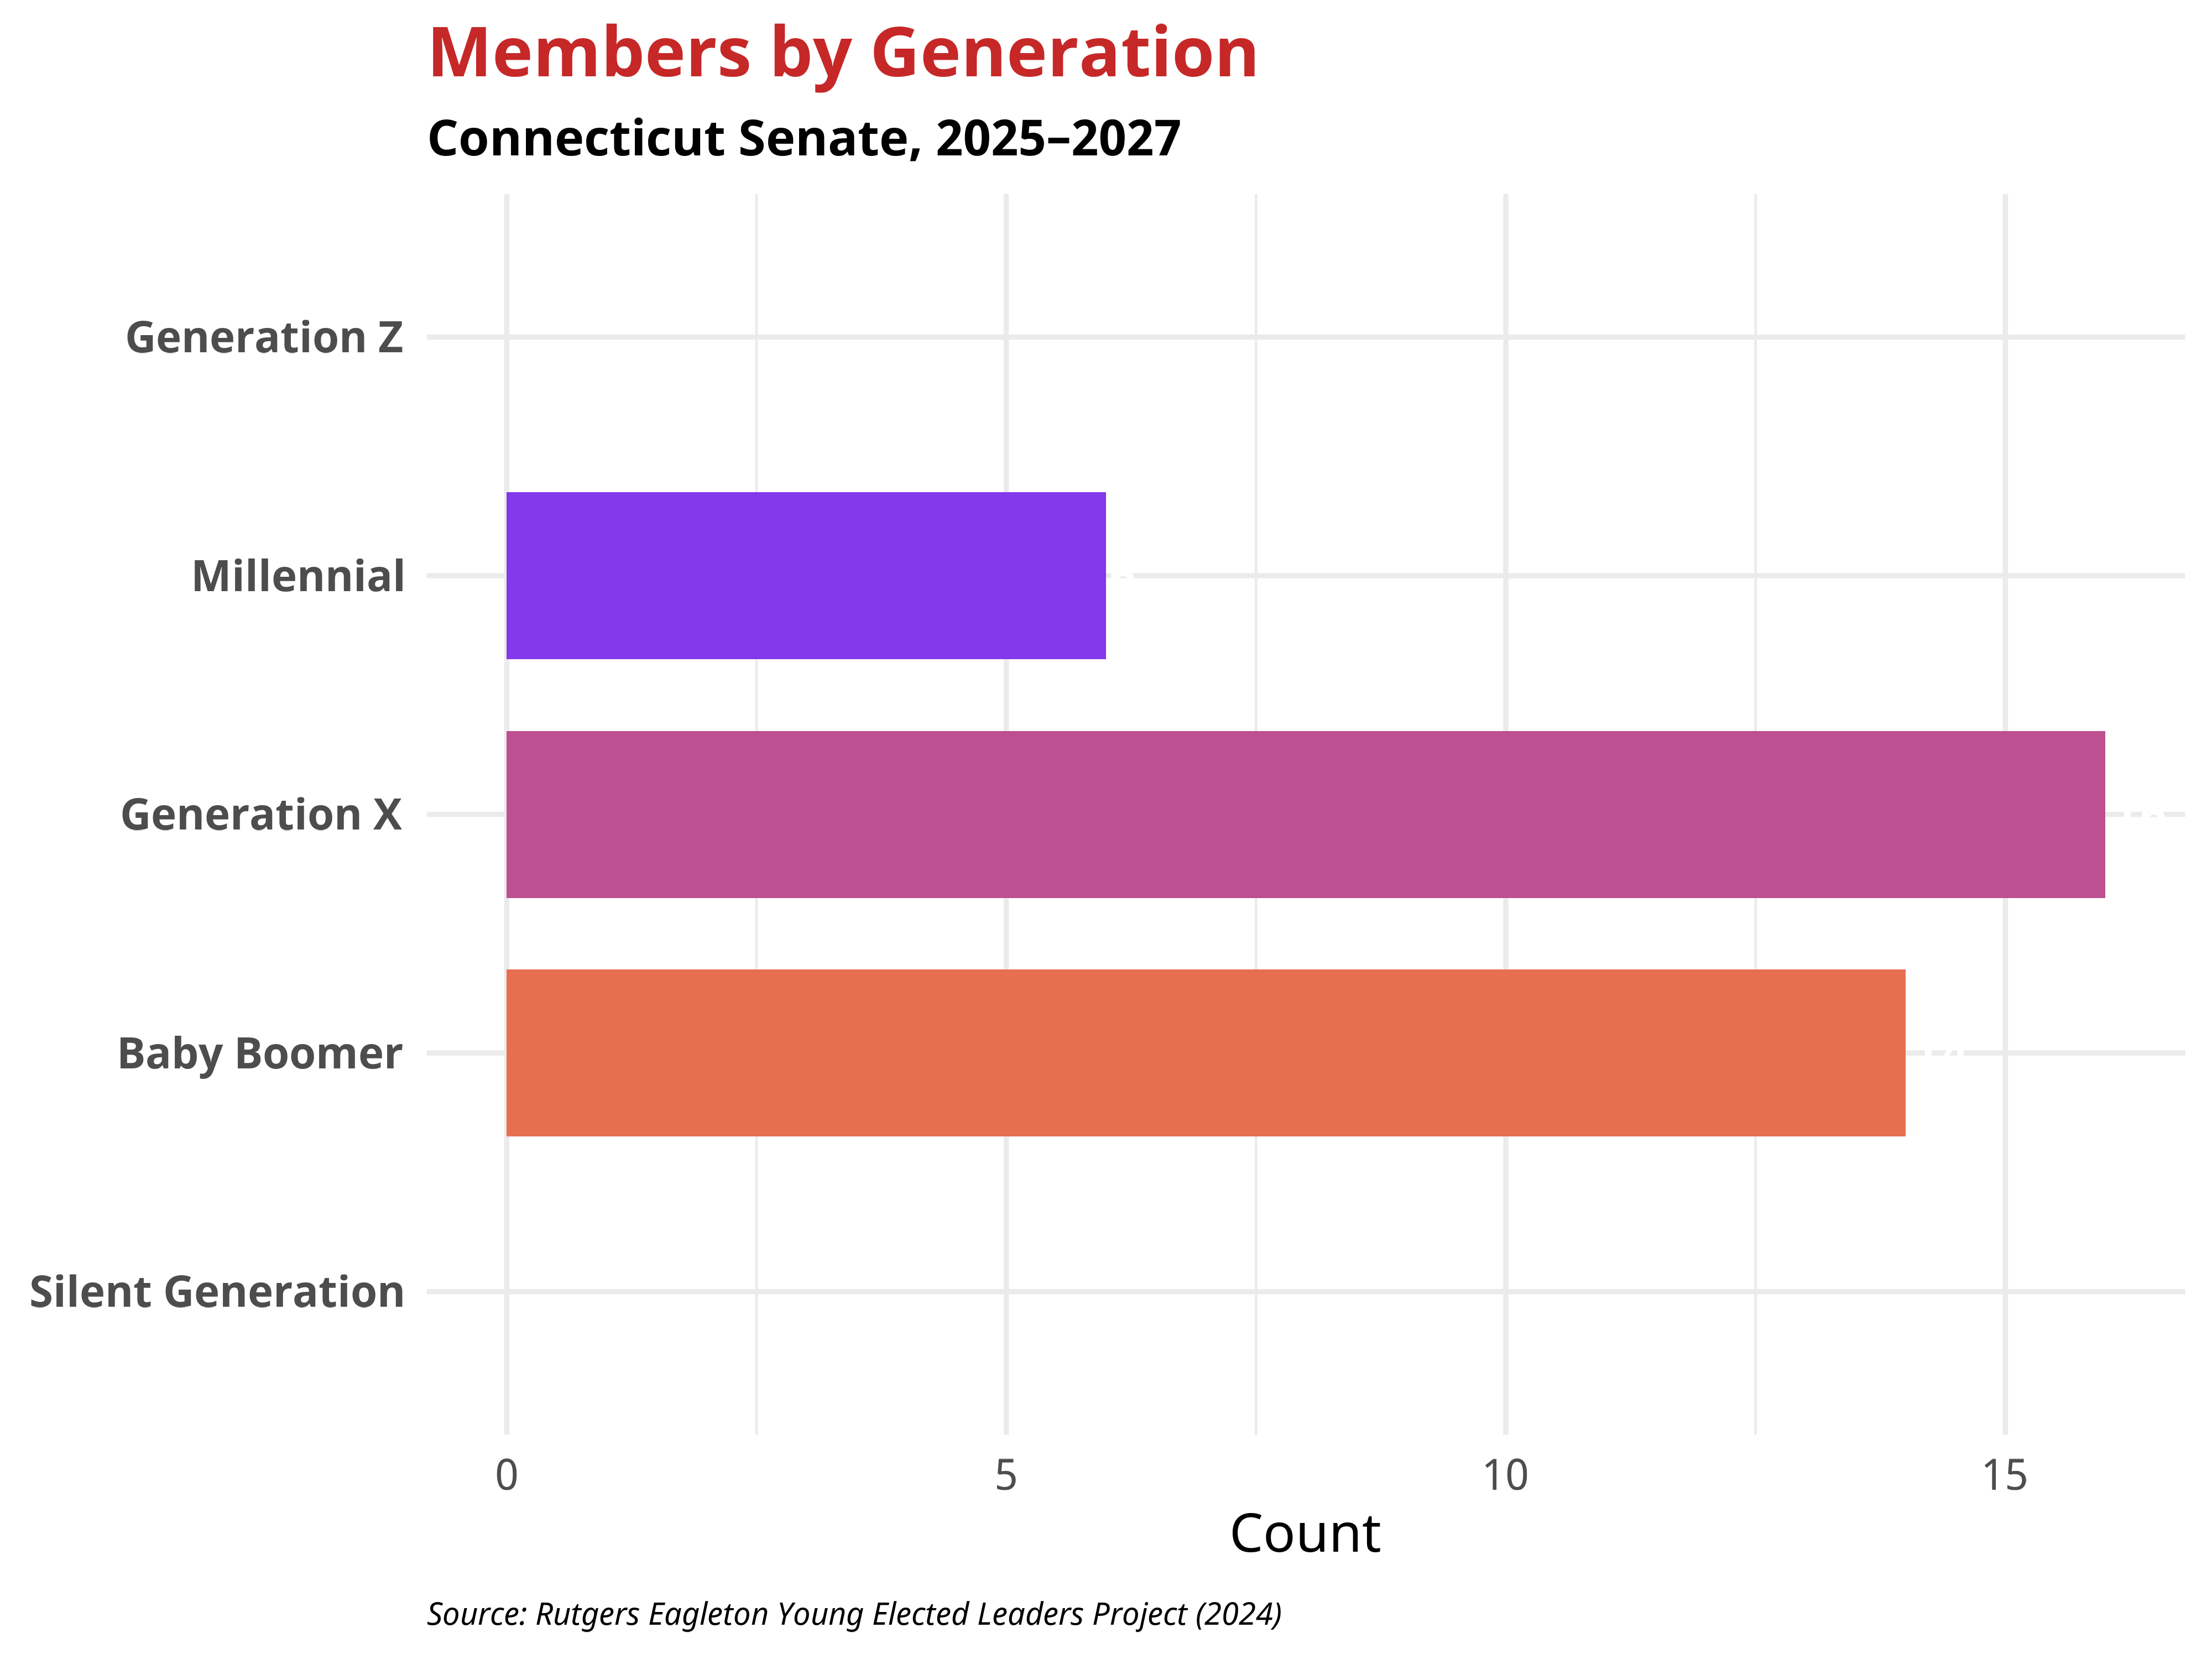
The racial and ethnic composition of the Connecticut Senate reveals generational variation in representation. While 75% of the chamber identifies as White across all generations, younger generations—especially Millennials—reflect greater diversity. For example, one third of Millennial senators are non white. Below is the breakdown of race and ethnicity within the Connecticut Senate.
Generations by Race/Ethnicity in the Connecticut State Senate
| Millennial Generation | Generation X | Boomer Generation | Full Chamber | |
|---|---|---|---|---|
| White | 4 (66.67%) | 11 (68.75%) | 12 (85.71%) | 27 (75.00%) |
| Black/African American | 1 (16.67%) | 2 (12.50%) | 1 (7.14%) | 4 (11.11%) |
| Hispanic | 1 (16.67%) | – | – | 1 (2.78%) |
| Asian/Pacific American | – | 1 (6.25%) | 1 (7.14%) | 2 (5.56%) |
| Other | – | 2 (12.50%) | – | 1 (5.56%) |
| Total | 6 (16.67%) | 16 (44.44%) | 14 (38.89%) | 36 (100%) |
Notes
The Young Elected Leaders Project applies the generational categorization of the Pew Research Center:
- Silent Generation: 1928 – 1945
- Baby Boomer Generation: 1946 – 1964
- Generation X: 1965 – 1980
- Millennial Generation: 1981 – 1996
- Generation Z: 1997 – 2012
This analysis is based on data from the most recent state legislative election in Connecticut which took place on November 5th 2024.
Citation Guideline
In referencing the Young Elected Leaders Project in publication please use the following language: “The Young Elected Leaders Project is housed at the Center for Youth Political Participation at The Eagleton Institute of Politics, Rutgers University – New Brunswick.”
Bibliographic Citation For this document
Author: Young Elected Leaders Project
Corresponding Authors: George D. Quinn
Year: 2024
Title: Age in the 2025 Connecticut General Assembly