The D.C. City Council
The Council of the District of Columbia functions as the city’s legislative body and is composed of 13 seats. While the district is not technically a state, there have been significant movements in the past to increase its representation and establish statehood.
Washington, D.C. Demographic Background
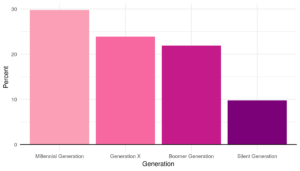
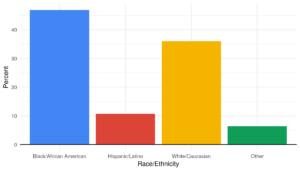
Contrary to the U.S. as a whole and most U.S. states, the Baby Boomer Generation is not the largest age group in Washington D.C. The largest generation is the Millennial Generation, which comprises almost 30% of the population, followed by Generation X (almost 24%). The smallest generation is the Silent Generation, consisting of about 10% of the population.1,2 About 47% of people in Washington, DC are Black/African-American, roughly 36% are White/Caucasian, almost 11% are Hispanic or Latino, and about 4% are Asian.3
Generational Breakdown of the D.C. City Council
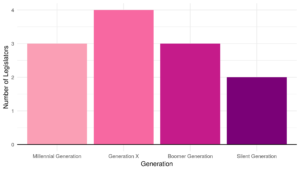
Millennials represent roughly 23% of all members of the Council of the District of Columbia. The largest generation represented in the Council is Generation X, comprising almost 31% of the Council, followed by the Millennial Generation and the Baby Boomer Generation, both representing about 23%.
Generational Breakdown of the D.C House of Representatives
| Generation | Number of Members | % of Total Members |
| Millenial Generation | 3 | 23.08% |
| Generation X | 4 | 30.77% |
| Baby Boomer Generation | 3 | 23.08% |
| Silent Generation | 2 | 15.38% |
| NA* | 1 | 7.69% |
Note: *Indicates state legislators for whom there is no birth date on record.
- The average age of the Council of the District of Columbia is 53
- The youngest member is 35 (Trayon White Sr.)
- The oldest member is 76 (Vincent C. Gray)
- 1 individual is a Young Elected Leader
- Trayon White Sr., 35
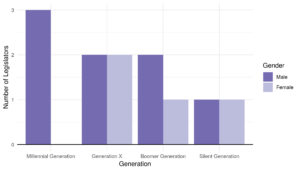
Gender Breakdown of the D.C. City Council
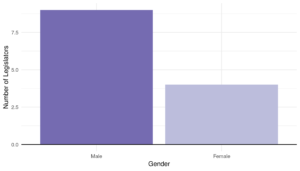
About 31% of members in the Council of the District of Columbia are women. There is one male Young Elected Leader on the Council. Female legislators are on average 57 years old, 5.6 years older than their male colleagues.

Gender of the D.C .City Council

Gender by Generation in the D.C. City Council
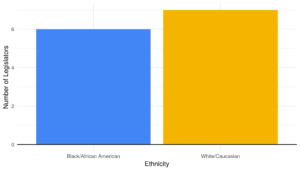
Ethnic Breakdown of the D.C. City Council
Roughly 46% of Council members are Black/African-American, while about 54% are White/Caucasian. There is one Young Elected Leader, who is Black/African-American. With approximately 48% of the D.C. population being Black/African-American according to the 2010 US Census, the D.C. City Council is fairly representative of D.C.’s Black population. However, there is no representation for Hispanics/Latinx and Asians.
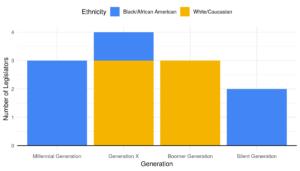
Generational differences are notable: Both the youngest and the oldest generations are represented by African American/Black Council members, whereas the Baby Boomer generation is represented by White Council members and both ethnicities/races are represented by Generation X.

Ethnicity by Generation in the D.C. City Council
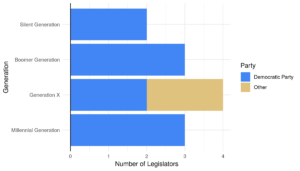
Partisan Breakdown of the D.C. City Council
A majority of the Council of the District of Columbia is Democratic, representing roughly 86% of membership. There are two members identifying as Independent, representing about 15%. The one Young Elected Leader on the Council is a Democrat.
Partisanship by Generation of the D.C. City Council
Notes
- The Young Elected Leaders Project collects and analyzes data on young elected officials across the country. We define Young Elected Leaders as officials 35 years and younger. We define the generations following the Pew Research Center:
- Generation Z: 1997-2012
- Millennial Generation: 1981-1996
- Generation X: 1965-1980
- Baby Boom Generation: 1946-1964
- Silent Generation: 1928-1945
2. Single Years of Age and Sex, 2010, US Census.
3. Geographic and Housing Estimates (Age, Sex, Race, Households and Housing, …) 2017, US Census.
This analysis is based on data from March 2019 and was conducted on July 19, 2019.