Florida State Legislature Snapshot
The State of Florida held its elections for a new state house and senate on November 4th 2024. New members elected on November 4th began serving on November 19th in the Florida State Legislature. Among the members elected 12 were aged 35 or younger on election day in 2024. Below is a map of these representatives within both chambers of the Florida General Assembly.
Florida Demographic Background in the 2024 Election
Preliminary estimates provided from CIRCLE at Tufts University indicate that 42% of young people aged 18-29 voted in the 2024 election, with turnout surpassing 50% in key battleground states. Nearly 50 million young citizens were eligible to vote, including over 8 million young voters who turned 18 since the 2022 midterms. In Florida, young voters had the opportunity to shape not only the presidential race but also a competitive U.S. Senate contest and 28 congressional elections. Young voters also played a critical role in deciding high profile ballot measures, including Amendment 3 on marijuana legalization and Amendment 4 on abortion regulations.
Nationally, according to the Pew Research Center, Millennials in 2020 overtook Baby Boomers as the largest generation in the U.S., comprising 31% of the population, followed closely by Baby Boomers at 30.9%. Generation X makes up 28%, while the Silent Generation is the smallest at 9.9%.
This election showcased the increasing diversity of the youth electorate, with notable differences in voting patterns by race, gender, and issue priorities. Given Florida’s unique demographics, voters elected 10 members to the Florida House of Representatives, who were age 35 and under on election day. Below is information about the generational backgrounds of the current Florida State Legislature.
The Florida House of Representatives 2024-2026 Legislative Session
Below is information covering age dynamics in the recently elected to the Florida House of Representatives
- the average age of Florida House of Representatives members is 51.48 years
- the youngest Representative Juan Carlos Porras was born in 2000
- the oldest Representative Gayle Harrell was born in 1943
- 10 Representatives are Young Elected Leaders age 35 or younger as of Election Day 2024
Generational Breakdown
Within the Florida House of Representatives, most representatives come from the Millennial, Generation X, Baby Boomer generation. Importantly, only a few members of the current Florida House of Representatives belong to Generation Z (youngest) and no members belong to the Silent Generation (oldest). Scroll below to see the generations in the Florida House of Representatives visualized.

Partisanship in the Florida House of Representatives
The chart below further breaks down the current partisan makeup of the 2025 Florida House of Representatives. Each dot represents a single member, colored by both party affiliation and whether the legislator qualifies as a Young Elected Leader (YEL)—defined as age 35 or younger at the time of the election. This format provides a visual snapshot of generational and partisan distribution within the chamber, highlighting how younger legislators are positioned across party lines.
Partisan dynamics in the Florida House of Representatives reflect not only ideological differences but also generational contrasts. The visual below highlights one key distinction: the average age of legislators by party. While both parties include a mix of experience levels, Republican members are, on average, older than their Democratic counterparts. This difference may reflect broader trends in political recruitment, generational turnover, and candidate emergence in recent election cycles.

Young Elected Representatives – Florida House of Representatives
Following the 2024 State Legislative Elections in Florida, ten members aged 35 or under were elected to the Florida House of Representatives. Below are all ten of these members along with information about their local districts and party affiliation.
| Name | District | Birth year (Age on Election Day) | Year first elected to Florida House | |
|---|---|---|---|---|
 |
Juan Carlos Porras (R) | 119th District –
Miami, FL |
1997 (Age 27) | 2022 |
 |
Josie Tomkow (R) | 51st District –
Polk City, FL |
1995 (Age 29) | 2018 |
 |
Kaylee Tuck (R) | 83rd District –
Lake Placid, FL |
1994 (Age 30) | 2020 |
 |
Sam Greco (R) | 51st District –
St. Augustine, FL |
1992 (Age 32) | 2024 |
 |
Jervonte Edmonds (D) | 88th District –
West Palm Beach, FL |
1991 (Age 33) | 2022 |
 |
Demi Busatta Cabrera (R) | 114th District –
Coral Gables, FL |
1990 (Age 34) | 2020 |
 |
Dan Daley (D) | 96th District –
Coral Springs, FL |
1990 (Age 34) | *2019 |
 |
Anna V. Eskamani (D) | 42nd District –
Orlando, FL |
1990 (Age 34) | 2018 |
 |
Robert Alexander Andrade III (R) | 2nd District –
Pensacola, FL |
1989 (Age 35) | 2018 |
 |
David Borrero (R)
|
111th District –
Sweetwater, FL |
1988 (Age 35) | 2020 |
Photos courtesy of Florida State Legislature member roster
* Member first elected during a special election
Gender in the Florida House of Representatives
The Florida House of Representatives reflects a range of age and gender dynamics that help shape the composition of the state’s legislative body. Across all members, 54.62% are men, while women make up the remaining 45.38%. Age differences between these groups are notable: female representatives had an average age of 52.35 at the time of the election, compared to 50.41 for their male colleagues. Of the the ten Young Elected Leaders, 4 are female, 6 male.

When examining both gender and party affiliation, additional differences in age emerge within the Florida House of Representatives. Republican men have the lowest average age of the four groups at 50.4, while Democratic men have a slightly higher average age of 50.43. For women in the Florida House of Representatives, both parties are on average older, with Democratic women averaging the highest of all four groups at 52.65 and Republican women averaging 52.65. Overall across both parties the average for all groups across party and gender lies above 50 years old. These patterns show that age representation in the Florida House of Representatives varies by both gender and partisan alignment, highlighting differing pathways to political office across demographic groups.

Race and Ethnicity in the Florida House of Representatives
The racial and ethnic composition of the Florida House of Representatives varies significantly across generations. In the 2024 Florida House younger generations are overall more diverse. For example, 62.5% of Millennial legislators identified as White, compared to 69.2% of the full chamber and 70% of Baby Boomer legislators. This table highlights how race and ethnicity intersect with age in shaping the diversity of the legislative body.
Generations by Race/Ethnicity in the Florida House of Representatives
|
Generation Z 1997 – |
Millennial Generation
1981 – 1996 |
Generation X
1965 –1980 |
Boomer Generation
1946 – 1964 |
Silent Generation
1928 – 1945 |
Full Chamber | |
|---|---|---|---|---|---|---|
| White/Caucasian | – | 20
(62.50%) |
40
(74.07%) |
21
(70.00%) |
– | 81
(69.23%) |
| Black/African American | – | 8
(25.00%) |
8
(14.81%) |
7
(23.33%) |
– | 23
(19.66%) |
| Hispanic/Latino | 1
(100%) |
2
(6.25%) |
5
(9.26%) |
(6.67%) |
– | 10
(8.55%) |
| Two or More Ethnicities | – | 2
(6.25%) |
1
(1.85%) |
– | – | 3
(2.56%) |
| Total (Precent of Florida House) | 1
(0.85%) |
32
(27.35%) |
54
(46.15%) |
30
(25.64%) |
– | 117*
(100%) |
*Missing age for one member and two seats are currently vacant. The full Florida House of Representatives is comprised of 120 seats.
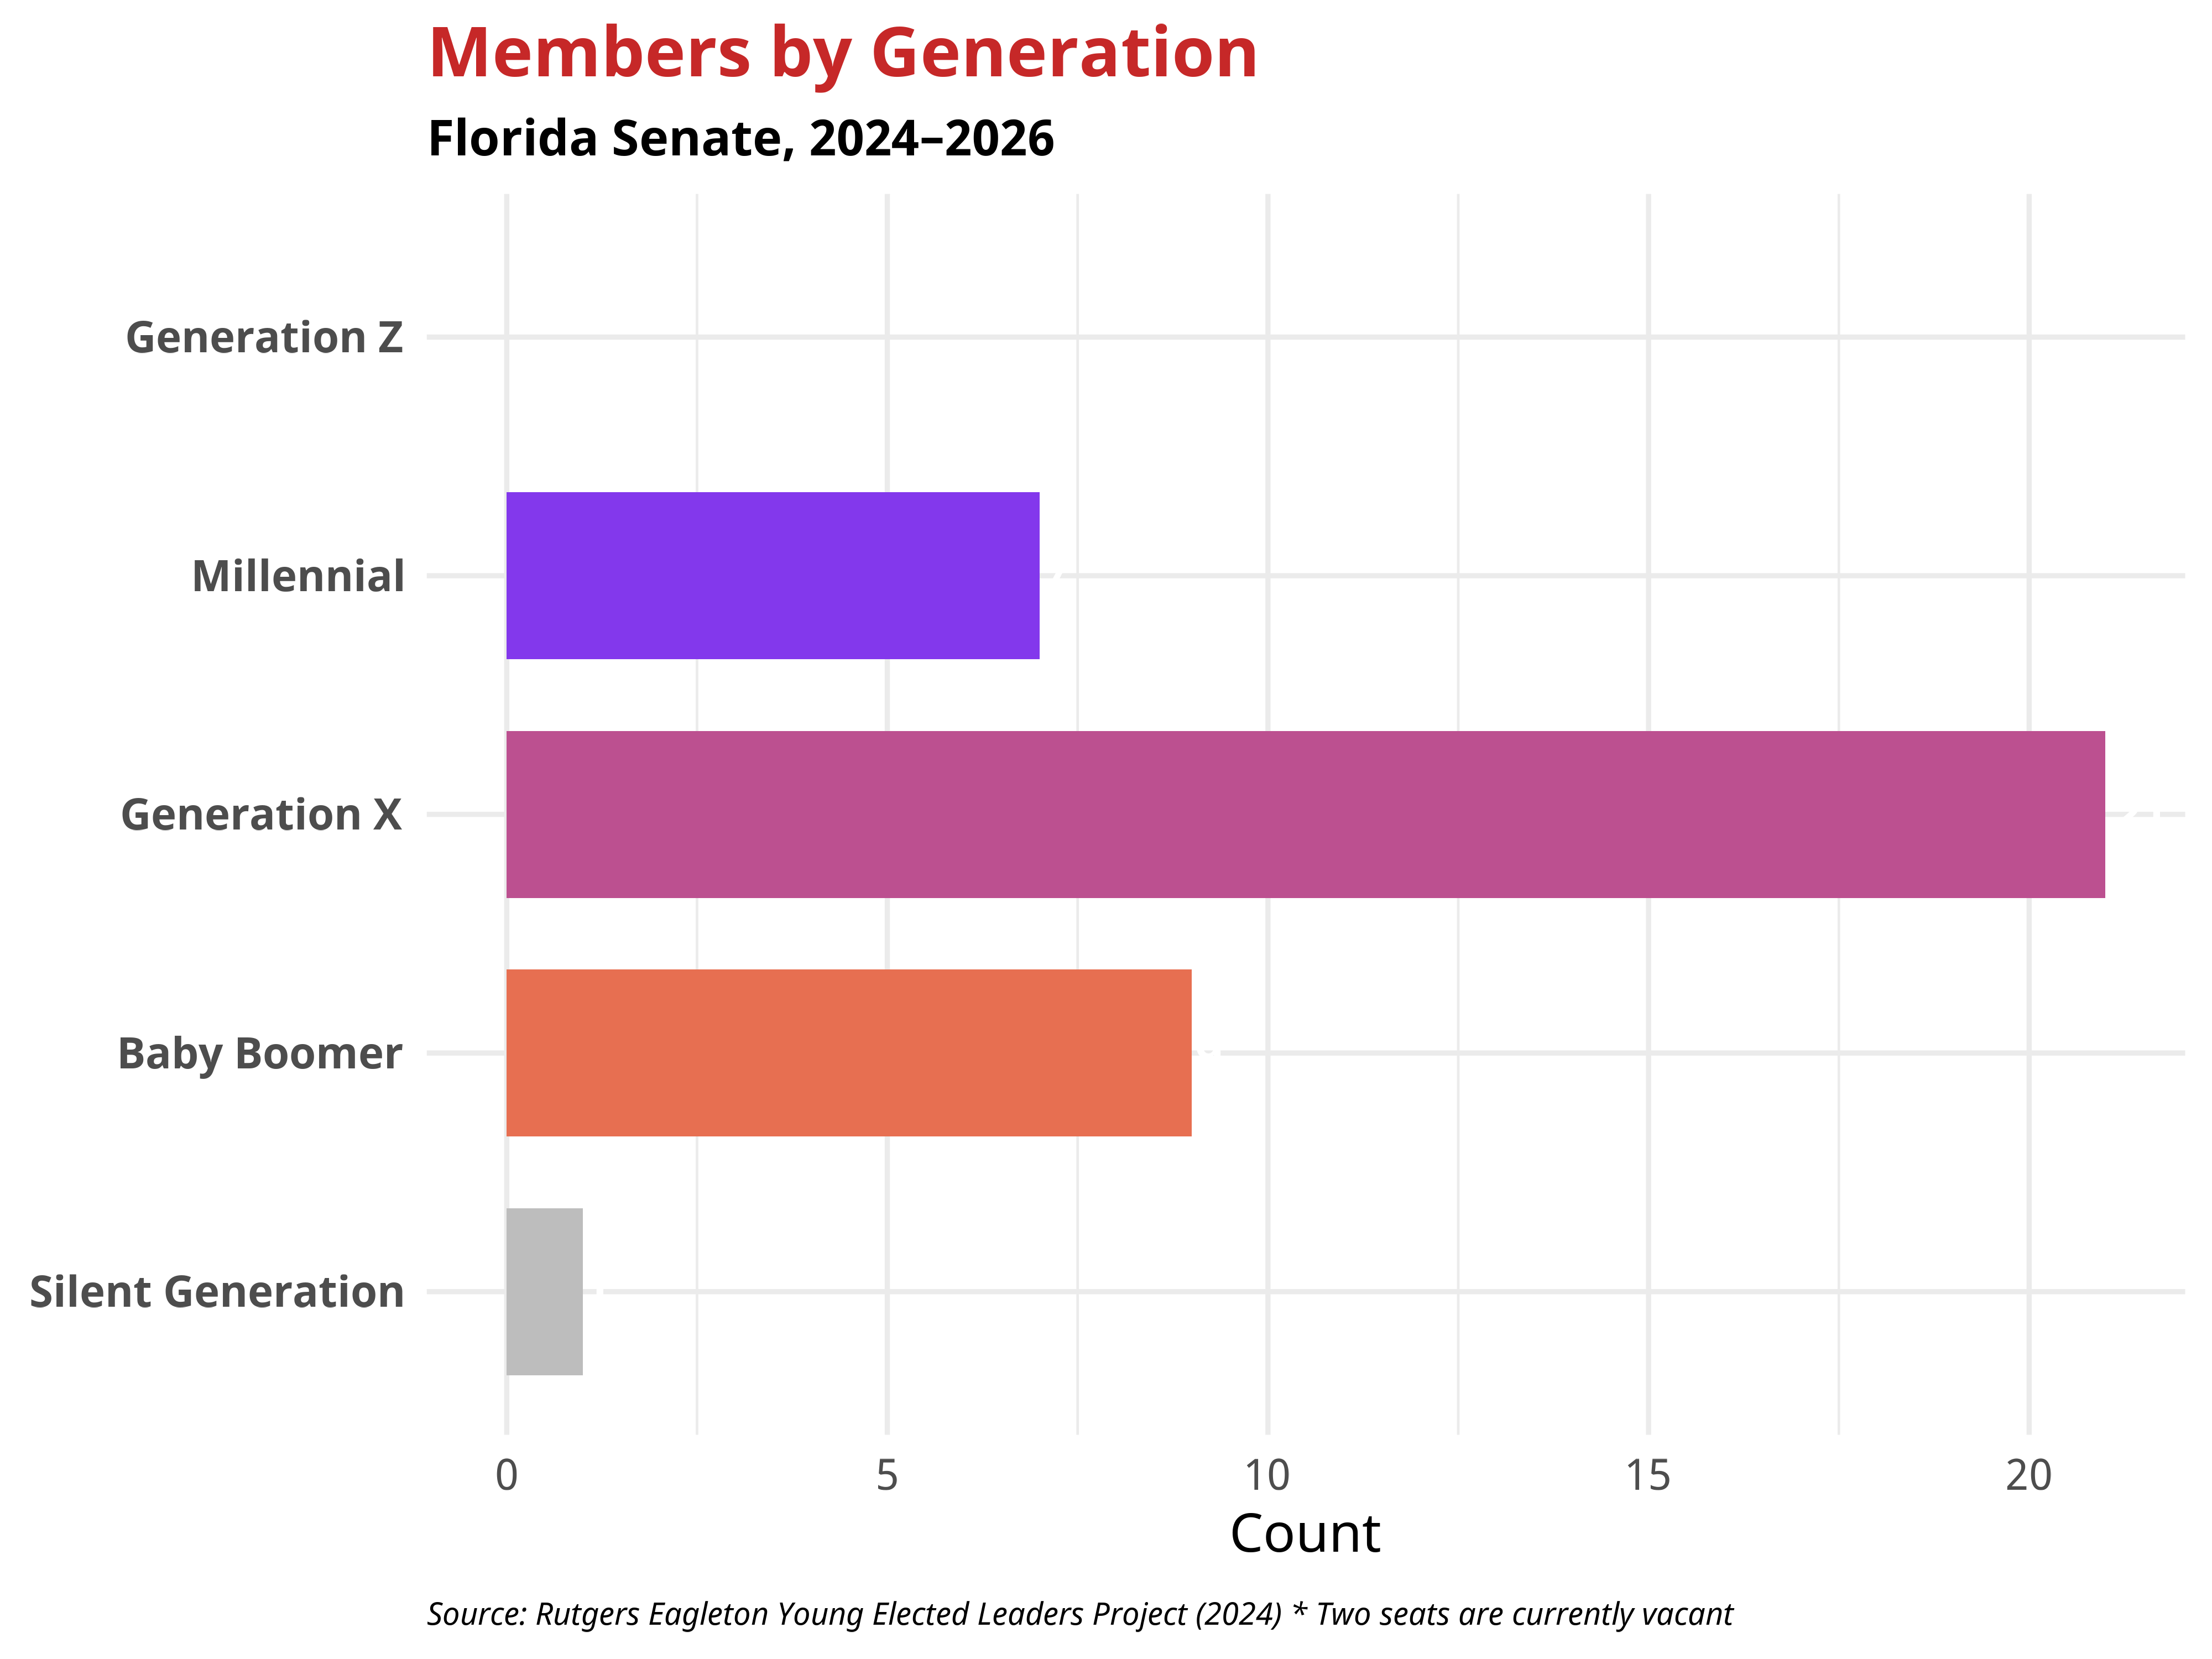
The Florida Senate
Below is information covering age dynamics in the recently elected Florida State Senate.
- the average age of Florida State Senate members is 54.47 years
- the youngest Senator Alexis Calatayud who was born in 1993
- the oldest Senator Gayle Harrell who was born in 1943
- 2 Senators are Young Elected Leaders, aged 35 or younger as of Election Day 2024
Young Elected Senators in the Florida State Senate
Following the 2024 State Legislative Elections in Florida, two member aged 35 or under were elected to the Florida State Senate. Below is information about their local districts and party affiliation.
| Name | District | Birth Year (Age on Election Day) |
Year First Elected to the Florida State Senate |
|
|---|---|---|---|---|
 |
Alexis Calatayud (R) | 38th District – Miami, FL | 1993 (Age 31) |
2022 |
 |
Jay Trumbull (R) | 2nd District – Panama City, FL | 1989 (Age 35) |
2022 |
Photos courtesy of Florida State Senate member roster
In the Florida State Senate, 10 senators belong to the Democratic Party, 27 senators are Republicans, and one is an Independent. The mean age of Democratic state senators after the 2024 election was 54.36, while the mean age of Republican state senators was 54.73. Each generation had a different partisan makeup. Below is the breakdown of party composition for each generation within the Florida State Senate.

Gender in the Florida Senate
The generational makeup of the Florida Senate also reflects important gender dynamics. Across generations, gender balance is more male skewed across generations. Overall more men are represented than women in every generational cohort. These patterns suggest that gender balance varies across generational lines, with women represented in each age cohort of the Florida Senate.

Race and Ethnicity in the Florida Senate
The racial and ethnic composition of the Florida Senate reveals generational variation in representation. While 68.42% of the chamber identifies as White across all generations, younger generations—especially Millennials—reflect greater diversity with 57.14% of members being White. Below is the breakdown of race and ethnicity within the Florida Senate.
Generations by Race/Ethnicity in the Florida State Senate
| Millennial Generation | Generation X | Boomer Generation | Silent Generation | Full Chamber | |
|---|---|---|---|---|---|
| White | 4 (57.14%) | 13 (61.90%) | 8 (88.89%) | 1 (100%) | 26 (68.42%) |
| Black/African American | 1 (14.29%) | 5 (23.81%) | 1 (11.11%) | – | 7 (18.42%) |
| Hispanic | 2 (28.57%) | 3 (14.29%) | – | – | 5 (13.16%) |
| Total | 7 (18.42%) | 21 (55.26%) | 9 (23.68%) | 1 (2.63%) | *38 (100%) |
*Two senate seats are currently vacant. The full Florida State Senate is comprised of 40 seats.
Notes
The Young Elected Leaders Project applies the generational categorization of the Pew Research Center:
- Silent Generation: 1928 – 1945
- Baby Boomer Generation: 1946 – 1964
- Generation X: 1965 – 1980
- Millennial Generation: 1981 – 1996
- Generation Z: 1997 – 2012
This analysis is based on data from the most recent state legislative election in Florida which took place on November 5th 2024.
Citation Guideline
In referencing the Young Elected Leaders Project in publication please use the following language: “The Young Elected Leaders Project is housed at the Center for Youth Political Participation at The Eagleton Institute of Politics, Rutgers University – New Brunswick.”
Bibliographic Citation For this document
Author: Young Elected Leaders Project
Corresponding Authors: George D. Quinn
Year: 2024
Title: Age in the 2025 Florida State Legislature